Question-and-Answer Resource for the Building Energy Modeling Community
Get started with the Help page
Ask Your Question
2

What is the purpose of the measure type in OpenStudio analysis spreadsheet?

asked 2017-10-14 20:19:51 -0500

antonszilasi's avatar

updated 2017-10-15 18:38:40 -0500

I am trying to understand the difference between the three measures types variable,pivot and argument which I see available in the OpenStudio analysis spreadsheet.

image description

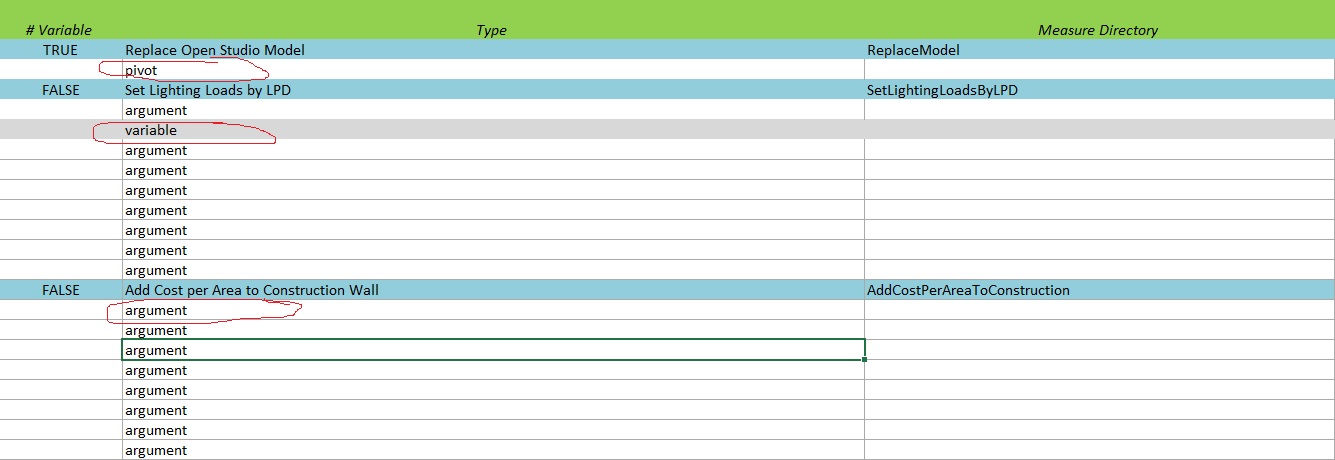
To my knowledge (correct me if I'm wrong) variable type measures are used for when you want to change a discrete value using an array of variables.

While arguement type measures are used when you simply want to run a measure which takes set arguements like Bool,Double, Integers and not an array of arguements?

However I noticed that some measures are pivot type such as the replace_open_studio_model measure - what exactly is a pivot type and when do I use it?

Any pointers on what is the difference between these measure types and when each is most appropriate would be greatly appreciated!

edit retag flag offensive close merge delete

Comments

Just for clarity Those are measure input parameter types, not measure types.

__AmirRoth__'s avatar __AmirRoth__  ( 2017-10-15 18:38:21 -0500 )edit

1 Answer

Sort by ยป oldest newest most voted
1

answered 2017-10-15 13:55:35 -0500

Hi,

There is some documentation for PAT 2.0 that provides some explanation -- scroll down a bit to the section where it lists Argument, Discrete, Continuous, and Pivot. As PAT 2.0 now includes the same capabilities that were available in the analysis spreadsheet, the same description applies. I'll paste it here as well:

  1. Argument - Fixes the quanity as a static value for the analysis.
  2. Continuous - Assigns a continuous probability density function to a variable. Available distributions include uniform, triangular, normal, and log normal.
  3. Discrete - Allows the user to specify a specific set of distinct values with associated weights.
  4. Pivot - Forces the entire analysis to be performed against each specified value. e.g. An analysis problem with 25 samples and 3 pivots would create a total of 75 data points.

Note that a Variable in the analysis spreadsheet could either be of type Continuous or Discrete.

edit flag offensive delete link more

Your Answer

Please start posting anonymously - your entry will be published after you log in or create a new account.

Add Answer

Careers

Question Tools

1 follower

Stats

Asked: 2017-10-14 20:19:51 -0500

Seen: 118 times

Last updated: Oct 15 '17