Question-and-Answer Resource for the Building Energy Modeling Community
Get started with the Help page
Ask Your Question
5

Chiller Performance Curves in IES-VE

asked 2017-08-21 21:01:14 -0600

I'm having trouble understanding how IES normalizes its chiller performance curves. Here is the window for the EIRfPLR&dT curve for a generic centrifugal chiller with VSD (as a side note- does anyone know why just the last coefficient is different than the corresponding DOE2.2 curve?):
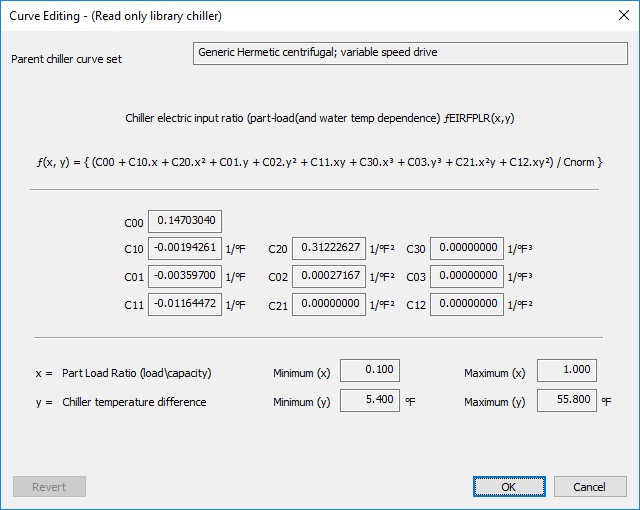
IES Centrifugal VSD EIRfPLR&dT curve

Notice the "/Cnorm}" part of the equation. When I do my own spreadsheet calculations to determine the distribution of this curve over various PLRs and CWDTs, I can't seem to ever determine how IES gets to its "EIR Factors" shown in the image below:
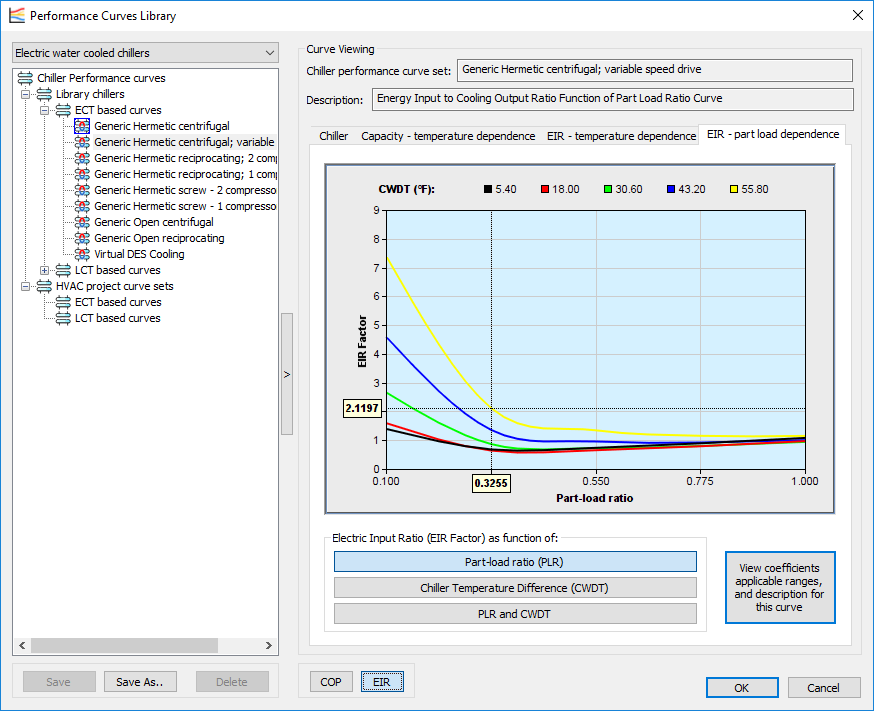
image description

In my hand calculation, I calculated the curves based on the same equation and coefficients as in IES, and divided each data point by the PLR.
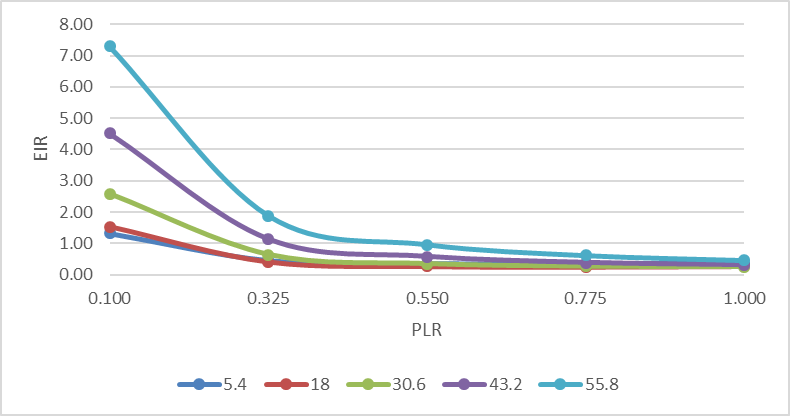
image description

This is close, but isn't quite there yet. IES's curve shifts up towards 1 at the tail end, insted of down like mine does. IES's documentation says that Cnorm is adjusted so that the curve yields "1" at the rated conditions, which in this case would be a PLR of 1 and CWDT of 41F. However, when I try to adjust the curves in this way, I instead get very high values at low PLRs due to dividing by a Cnorm that is less than 1:
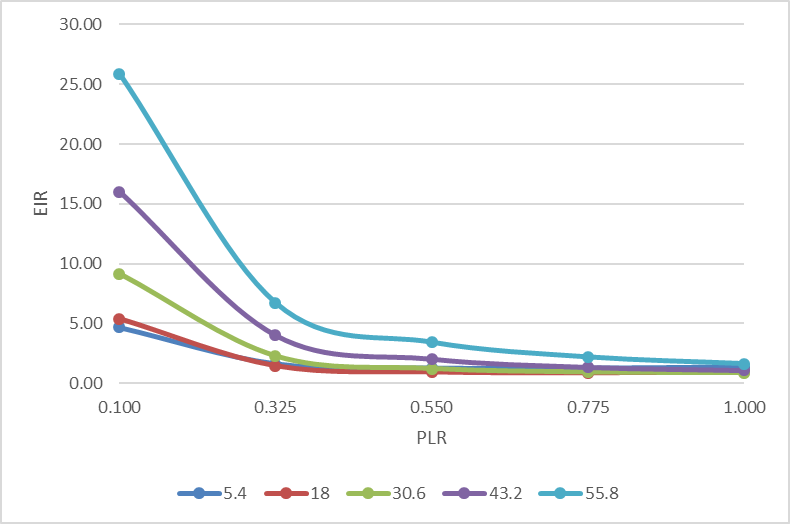
image description

Any ideas how how IES calculates it's "Cnorm"?

edit retag flag offensive close merge delete

Comments

Perhaps Cnorm is a piecewise function, and It adjusts the EIR curves only at PLR = 1

TomB's avatar TomB  ( 2017-08-22 20:48:55 -0600 )edit

You didn't show the data used for regression but I have in the past added data points at one end of the curve to "pull" the curve in the intended direction. The neat thing about regressing is that the residuals are minimized and another data point will pull the curve in the direction of the new data point.

rraustad's avatar rraustad  ( 2017-08-22 20:59:12 -0600 )edit

2 Answers

Sort by ยป oldest newest most voted
5

answered 2017-10-12 01:11:09 -0600

updated 2018-01-08 23:44:28 -0600

Update 2018/01/09 I heard back from IES on this and they found that there is an issue with chiller curves when using IP units. There is no issue if you are using SI units. For default curves in IP there is an incorrect conversion being applied which affects the visualization. This does not actually affect the simulation results. However, if you create a custom chiller curve in IP the conversion will affect results, so use SI when inputting a custom chiller curve.


Cnorm is the result of the curve at the design conditions. For curves that do not result in "1" at the rated condition, this will "normalize" the curve for you. Though all of the default eQuest curves already equal "1" at rated conditions and don't need this (though if you are using design conditions it might).

The EIRrated curve is created using this equation:

EIRrated = EIRfPLR / PLR

edit flag offensive delete link more
2

answered 2017-08-25 17:00:05 -0600

crduggin's avatar

I do know the IES curves have been updated to be the ones from E+ rather than DOE2.2, so that would explain one part.

edit flag offensive delete link more

Your Answer

Please start posting anonymously - your entry will be published after you log in or create a new account.

Add Answer

Training Workshops

Careers

Question Tools

1 follower

Stats

Asked: 2017-08-21 21:01:14 -0600

Seen: 1,407 times

Last updated: Jan 08 '18