Question-and-Answer Resource for the Building Energy Modeling Community
Get started with the Help page
Ask Your Question
2

hourly values of outdoor air flow

asked 2016-09-19 19:55:49 -0600

Anna's avatar

updated 2017-04-16 11:17:21 -0600

This is probably a very simple question, but would appreciate if someone can help me out. I’m using Energy Plus to simulate a typical VAV system and want to confirm that my outdoor air is modeled correctly (zero ventilation during unoccupied hours, and constant ventilation air during occupied hours). So, my first question is: How can I output the hourly values of the outdoor air flow for a VAV system? Also, I’m trying to understand Report: Outdoor Air Summary. How does Energy Plus determine the occupied hours? For example, my Average Outdoor Air During Occupied Hours is different from Minimum Outdoor Air During Occupied hours, although I would expect these two values to be the same.

Thanks!

edit retag flag offensive close merge delete

2 Answers

Sort by » oldest newest most voted
1

answered 2016-09-20 12:47:13 -0600

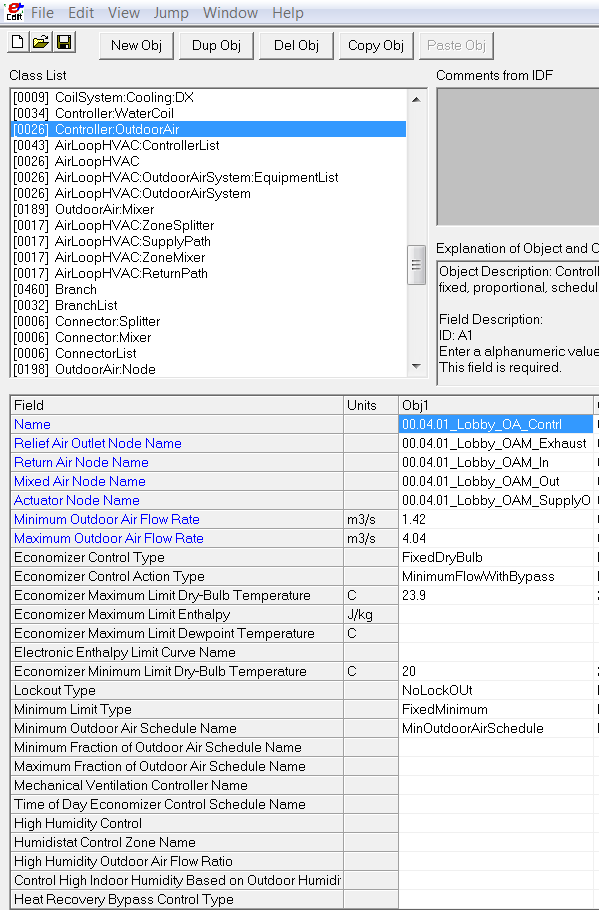
To control the outdoor air through your VAV you can use the outdoor air controller object. In here there is the minimum limit type, if you put that at "fixedMinimum" and then the Minimum Outdoor Air Schedule Name to a Factional Schedule, 0 off 1 on, then during the times you have put 0 in your fractional schedule there will be no outdoor air flow through your system. See picture of input below:

image description

To make sure that your outdoor air flow is off you can report out the system node flow rates and check the flow rates through the supply node on your OAM object.

edit flag offensive delete link more

Comments

Thanks Annie! After I defined the outdoor air controller, the outdoor air rates seemed to be modeled correctly. Originally, I had used Templates to specify my outdoor air. I'd specified Outdoor Air Method : Flow/Area for each zone and autosized the Minimum/Maximum Outdoor Air Flow Rate at the system level. I thought that E+ would apply the Minimum Outdoor Air Schedule to the autosized system values, but this apperently did not work as I expected.

Anna's avatar Anna  ( 2016-09-25 22:08:27 -0600 )edit
5

answered 2016-09-19 22:14:47 -0600

Add these output variables to your IDF for inspecting OA flow rates. Notice that these variables are requesting detailed (instead of hourly) results. This is because the simulation is running sub-hourly, and looking at hourly averages can be misleading.

Output:Variable,*,Air System Outdoor Air Mass Flow Rate,detailed; !- HVAC Average [kg/s]
Output:Variable,*,Air System Mixed Air Mass Flow Rate,detailed; !- HVAC Average [kg/s]
Output:Variable,*,Air System Outdoor Air Flow Fraction,detailed; !- HVAC Average []
Output:Variable,*,Air System Outdoor Air Minimum Flow Fraction,detailed; !- HVAC Average []

The results will come out as timeseries data in either the .csv or .sql output file, depending on what is listed in your input file. You can open the .sql file in ResultsViewer (installs with OpenStudio ) to plot the data.

For the second part:

Occupied Hours: any hour that the people fraction schedule is above zero

Minimum Outdoor Air During Occupied Hours: look at the timeseries and find the lowest amount of OA when occupancy is above zero.

Average Outdoor Air During Occupied Hours: look at the timeseries and find all the OA values when occupancy is above zero. Average these numbers.

Some things that can cause these numbers to be different:

  1. You have scheduled the OA damper closed when the occupancy is above zero. Maybe you were modeling a very low occupancy at night for cleaning crews. These still count as occupied hours for purposes of these outputs.
  2. Your system has DCV (demand control ventilation) that adjusts the OA flow rate based on the number of people in the zone.
edit flag offensive delete link more

Comments

Thank you Andrew! I was able to open the .sql in Results Viewer, and the plot clearly showed that the ventilation air was not modeled correctly. Can I chose where I would like to view my results (.csv or .sql) or the varaibles will come out in the files based on some other criteria? For example, I was able to view some variable in .csv ( e.g. zone air temperature) , but the outdoor air flow would come out only in .sql.

Anna's avatar Anna  ( 2016-09-25 21:32:59 -0600 )edit

The same Output:Variable values should show up in both the .csv and .sql file. At one time there was a limitation of 256 columns in the .csv because of the number of columns Excel supported. This limitation (in EnergyPlus) may still be in place, but I don't use the .csv enough to know. Check the .err file for a warning about the 256 column limit to see if this is what is happening.

aparker's avatar aparker  ( 2016-09-27 13:40:49 -0600 )edit

Your Answer

Please start posting anonymously - your entry will be published after you log in or create a new account.

Add Answer

Training Workshops

Careers

Question Tools

2 followers

Stats

Asked: 2016-09-19 19:54:45 -0600

Seen: 908 times

Last updated: Sep 20 '16