Question-and-Answer Resource for the Building Energy Modeling Community
Get started with the Help page
Ask Your Question
2

how to see thermal comfort improvements in hvac psychrometric chart ?

asked 2016-08-15 08:06:32 -0500

updated 2017-08-05 07:57:47 -0500

Hi everybody,

I did some changes for my existing room and proposed some improvements like adding shadings and so on. after printing the hvac psychrometric chart of existing room (image a) and proposal one (image b), I do not know how can I see the improvements in the image b?

Thanks in advance for any help.

image description 
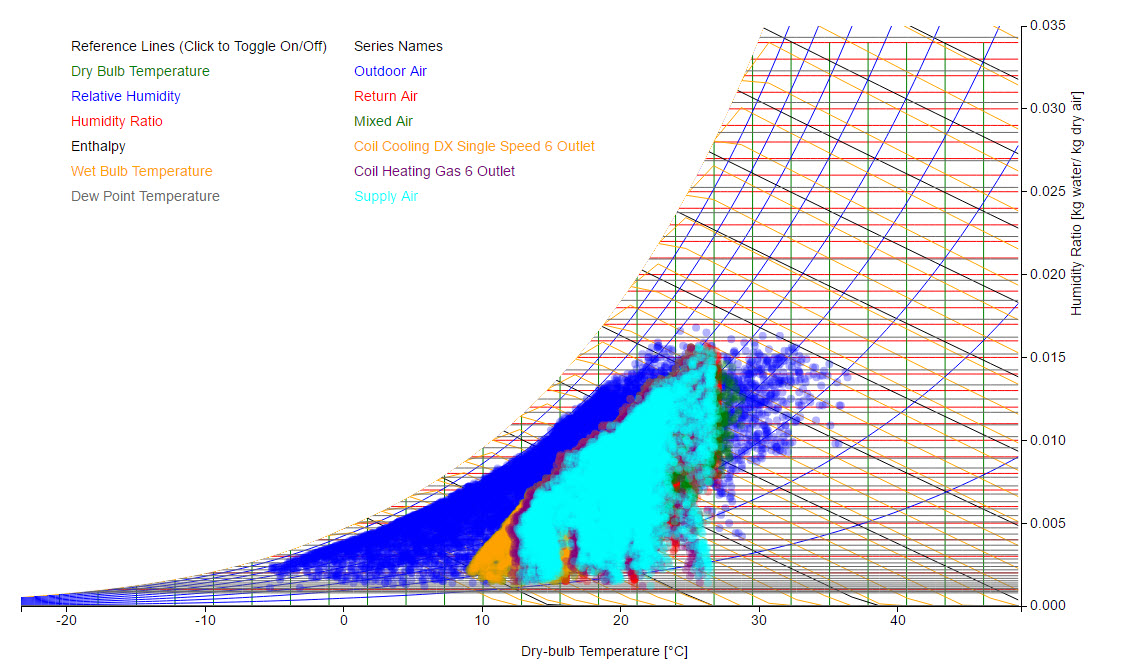
Image a (existing room with no improvements)

image description 
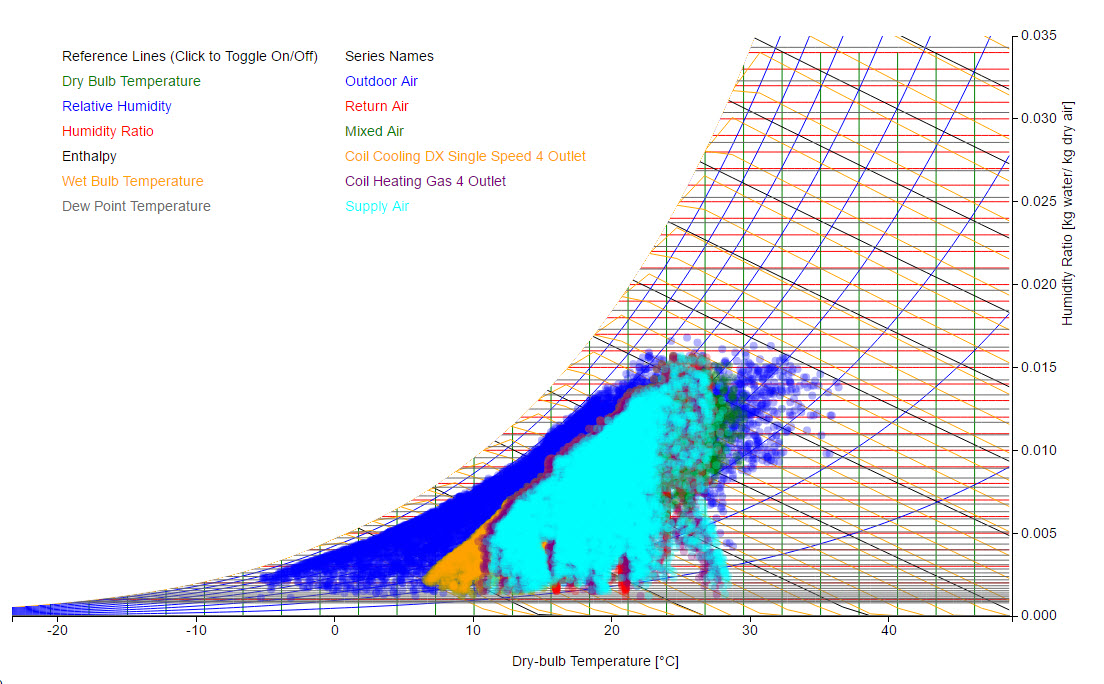
Image b (proposal room with improvements)

edit retag flag offensive close merge delete

Comments

ASHRAE 55 for thermal comfort information.

Adam Hilton's avatar Adam Hilton  ( 2016-08-15 11:28:18 -0500 )edit

Dear @adhilton, I have already studied about psychrometric charts but still my question remains, As this chart (HVAC psychrometric chart) is a little bit different with the others. in the others we do not have outdoor air, Return Air, Mixed Air ,Suply Air, Coil Cooling DX....

4Designer's avatar 4Designer  ( 2016-08-15 12:09:06 -0500 )edit
1

The majority of those variables aren't directly related to thermal comfort. Why aren't you just looking at Zone Temperature and Zone Humidity?

Adam Hilton's avatar Adam Hilton  ( 2016-08-15 13:34:11 -0500 )edit

@adhilton, but if I am right according to coordinates of blue points the range of zone temperature (-5 C to 36 C) and zone humidity (0.001 to 0.017) in the both charts are the same. In fact I really would like to know that how can I identify the improvements in image b(proposal room) compared to image a(existing room)?Thanks in advance for any guidance.

4Designer's avatar 4Designer  ( 2016-08-15 23:39:52 -0500 )edit

1 Answer

Sort by ยป oldest newest most voted
3

answered 2016-08-28 08:59:55 -0500

The psych chart you are looking at is primarily intended to look at the HVAC system air temperature and humidity, not the zone conditions. In this particular chart, the thing you might want to look at as a proxy for the zone is the Return Air (red). I don't think you can turn series on/off with this chart, so you might have to zoom around. The darker blue series shows the Outdoor Air; this is mixed with return air and then conditioned by the heating/cooling coils and introduced to the zone as Supply Air (light blue).

edit flag offensive delete link more

Comments

@aparker, Thank you for your informative answer, you mentioned that In this particular chart, the thing I might want to look at as a proxy for the zone is the Return Air (red) I would like to know that since red points (return air) in image b is in somehow more extended than image a, is it shows imrovement for thermal comfort or not?

4Designer's avatar 4Designer  ( 2016-08-28 09:22:12 -0500 )edit

Dear @David Goldwasser, it would be really appreciated that if I get any guidance from you. THANKS in advance.

4Designer's avatar 4Designer  ( 2016-08-30 08:08:16 -0500 )edit
1

@OS_4design, I haven't looked at it closely, but since both the min and max temps increase (with ideal temp somewhere in the middle), you may have helped thermal comfort in some areas and hurt it in others (when got too warm). But of course there are other factors than air temperature to thermal comfort.

David Goldwasser's avatar David Goldwasser  ( 2016-09-07 10:59:41 -0500 )edit
1

The OpenStudio Add Output Variable measure allows to add ASHRAE 55 information to your reports. This is done on the Measures tab of OpenStudio. You can add the following output variables, and they will be shown for each zone:

Zone Thermal Comfort ASHRAE 55 Simple Model Summer Clothes Not Comfortable Time Zone Thermal Comfort ASHRAE 55 Simple Model Winter Clothes Not Comfortable Time Zone Thermal Comfort ASHRAE 55 Simple Model Summer or Winter Clothes Not Comfortable Time

For each zone, the Results Viewer will show a graph with the not comfortable hours throughout the year.

Matt Koch's avatar Matt Koch  ( 2017-08-23 15:58:45 -0500 )edit

@Matt Koch, Thanks Matt for your response.

4Designer's avatar 4Designer  ( 2017-11-04 13:04:35 -0500 )edit

Your Answer

Please start posting anonymously - your entry will be published after you log in or create a new account.

Add Answer

Careers

Question Tools

2 followers

Stats

Asked: 2016-08-15 08:06:32 -0500

Seen: 1,141 times

Last updated: Aug 28 '16