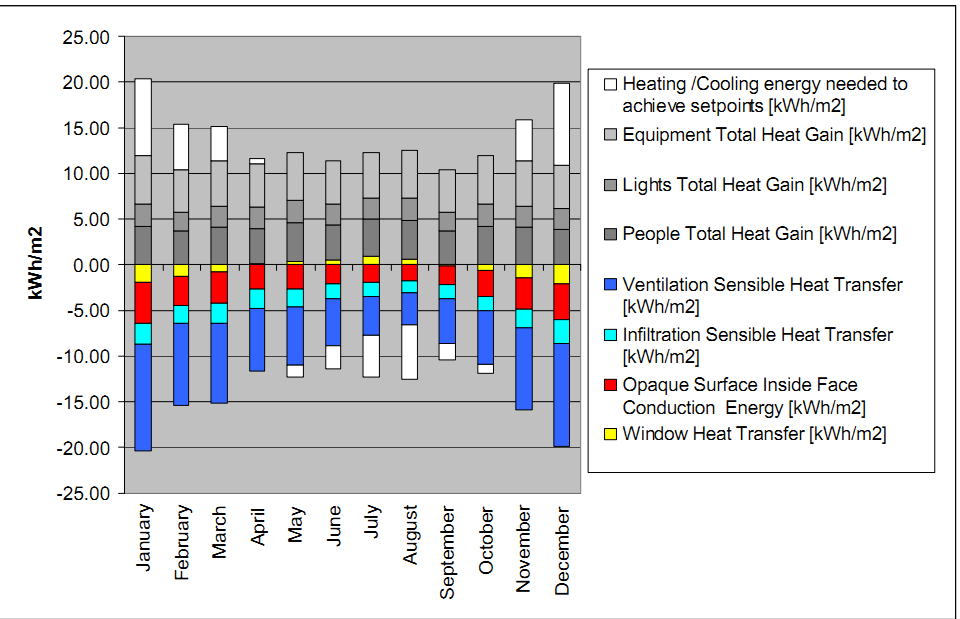
To report loads like this at different intervals, you will need to examine the RDD output file. This file contains a list of all possible output variables that can be reported to a CSV file and it changes depending upon what is included in your model (i.e. if there are no electric equipment objects, there can be no electric equipment outputs). Here are some outputs that you seem to be interested in:
Output:Variable,*,People Total Heating Energy,monthly; !- Zone Sum [J]
  *Need to have **People** objects in model*
Output:Variable,*,Lights Total Heating Energy,monthly; !- Zone Sum [J]
  *Need to have **Lights** objects in model*
Output:Variable,*,Electric Equipment Total Heating Energy,monthly; !- Zone Sum [J]
  *Need to have **ElectricEquipment** objects in model*
Output:Variable,*,Surface Inside Face Conduction Heat Transfer Rate,monthly; !- Zone Average [W]
  *Need to have **BuildingSurface:Detailed** or other opaque surface objects in model*
Output:Variable,*,Surface Window Heat Gain Rate,monthly; !- Zone Average [W]
  *Need to have **FenestrationSurface:Detailed** or other transparent surface objects in model*
Output:Variable,*,Zone Infiltration Sensible Heat Loss Energy,monthly; !- HVAC Sum [J]
  *Need to have **ZoneInfiltration:DesignFlowRate** objects in model*
Output:Variable,*,Air System Fan Air Heating Energy,monthly; !- HVAC Sum [J]
  *Need to have fan object as part of air system in model*
For the ventilation sensible heat transfer, you should probably use the sensible heat gain output variable for the ventilation fan. This may require some more post-processing work if you have lots of zones or objects, as you'll need to add the outputs in the CSV output file to get a total value for each category in the model
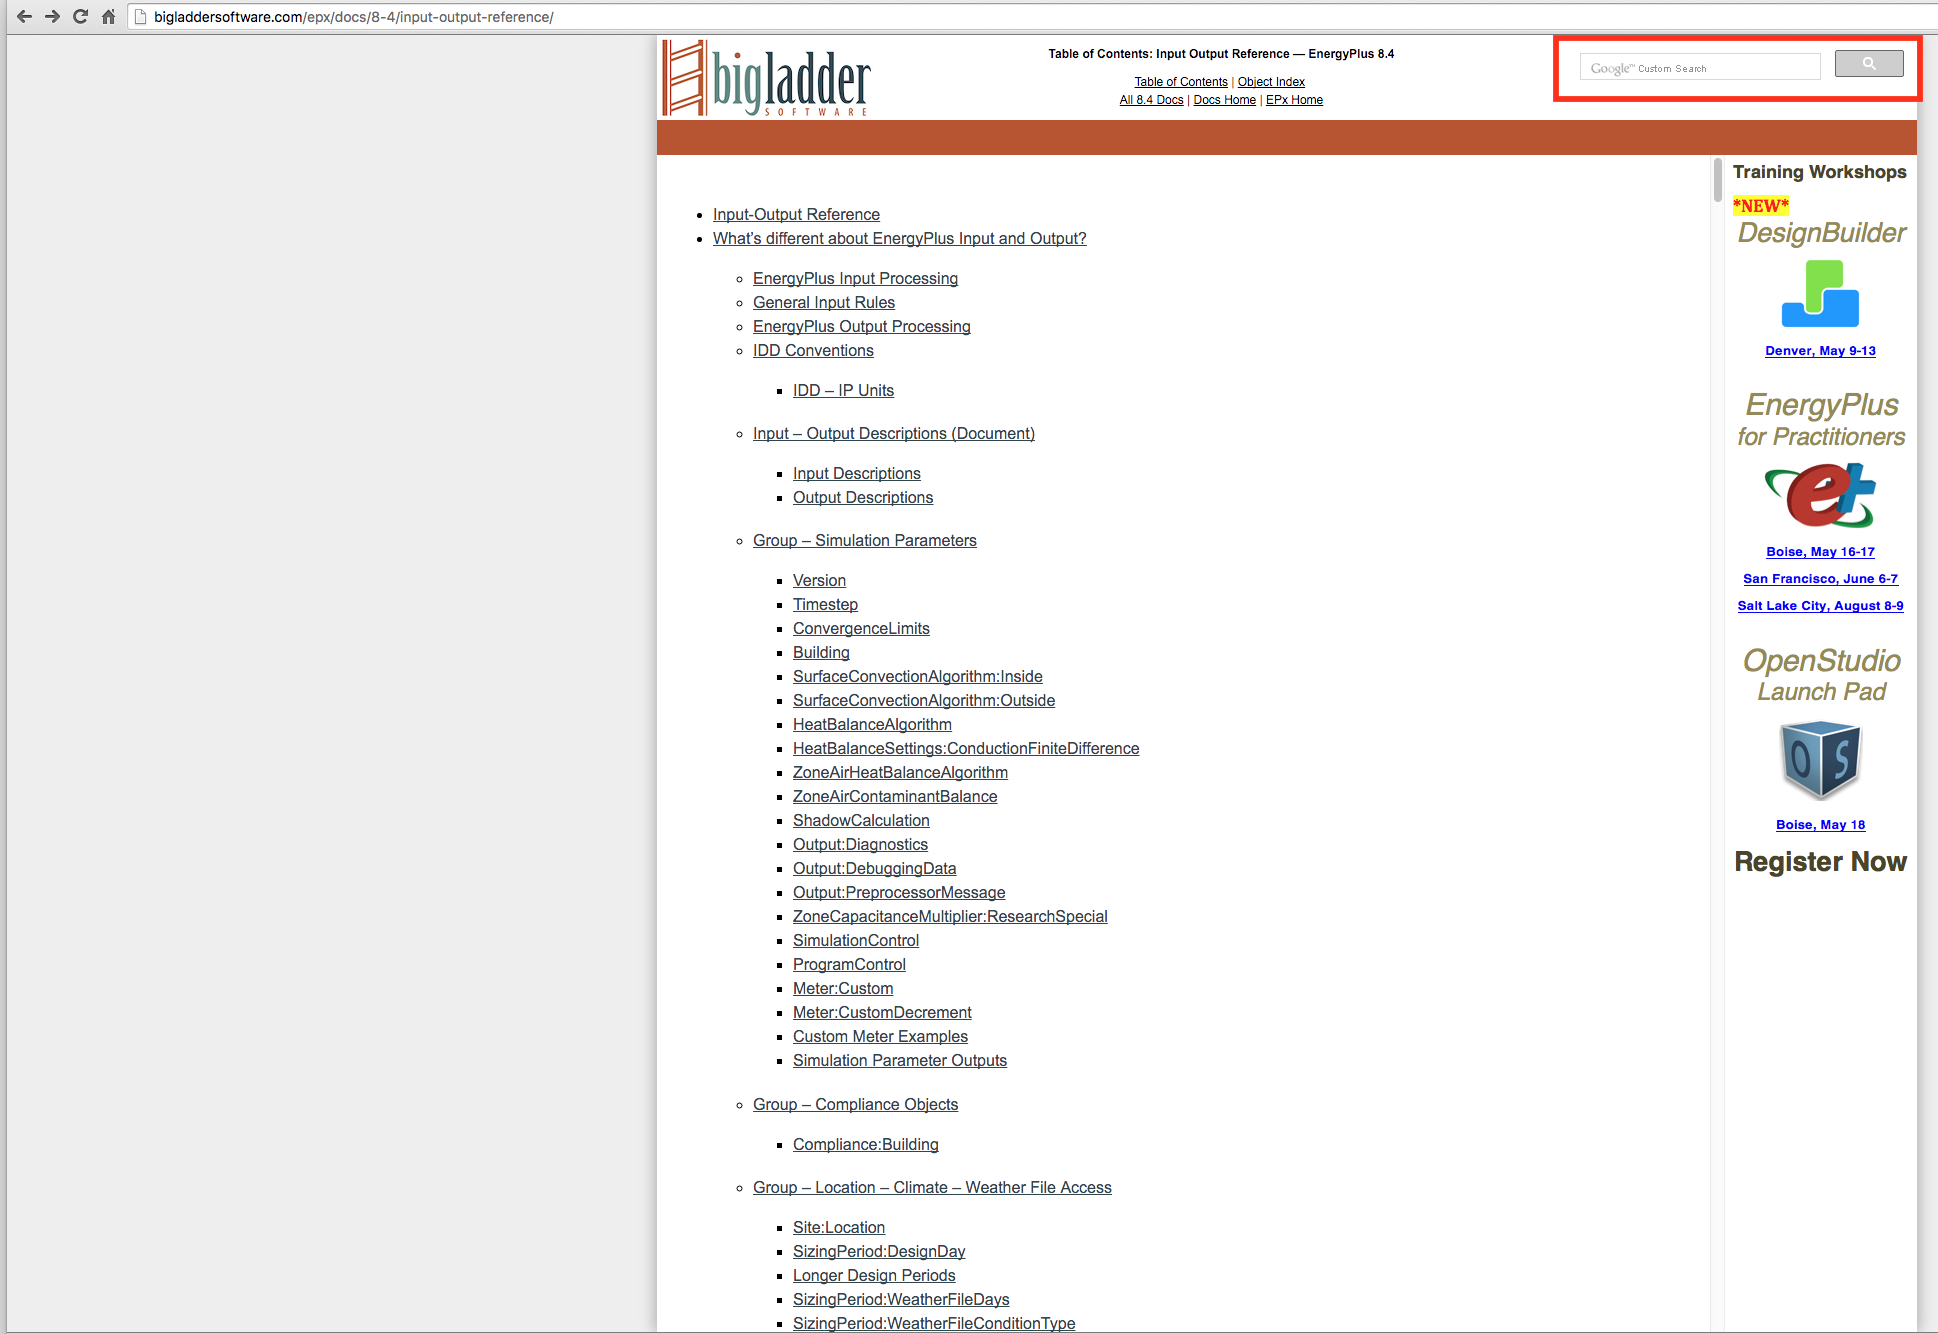
The last input field before the semi-colon ";" in each output variable is the reporting frequency. They are currently all set to monthly, but you can change that or even have multiple instances of the same output variable with different reporting frequencies. If you want to examine what model objects these output variables correspond to, it's easy to do a Google Custom Search from the online E+ Input / Output Reference documentation.

EDIT
If you are only interested in seeing annual summaries of typical sensible load contributions in each zone, then add the Sensible Heat Gain Summary option to the Output:Table:SummaryReports object.
 . I went through a lot different reports and variables but still did not fully get reasonable relation between the numbers.


