Question-and-Answer Resource for the Building Energy Modeling Community
Get started with the Help page
Ask Your Question
0

How can I get results of Openstudio output variables?

asked 2025-11-11 01:00:49 -0600

Jack Lee's avatar

updated 2025-11-11 08:28:20 -0600

Hi. I'm modeling a simple box and want to get output. I toggled on several variables in the OS, in output variables tab. (e.g., Site Diffuse Solar Radiation Rate per Arer)

The 'run simulation' was successful, but I don't know where to check the results ​​I toggled on. In the EP, there was a CSV file so I could check output variables(RDD). Where can I find the results in the OS?

I used OS 1.7.2 and EP 23.2 version. The model I used is shown in the attached file. Thanks in advance.

OSM file

image description

edit retag flag offensive close merge delete

Comments

In this thread, a method using eso files and the postprocess ReadVarsESO.exe was introduced. Is this the standard way? link

Jack Lee's avatar Jack Lee  ( 2025-11-11 01:30:12 -0600 )edit

2 Answers

Sort by » oldest newest most voted
1

answered 2025-11-11 04:36:44 -0600

Dutchie's avatar

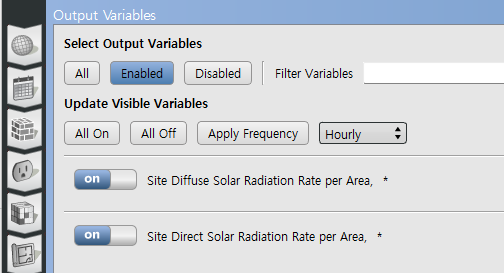
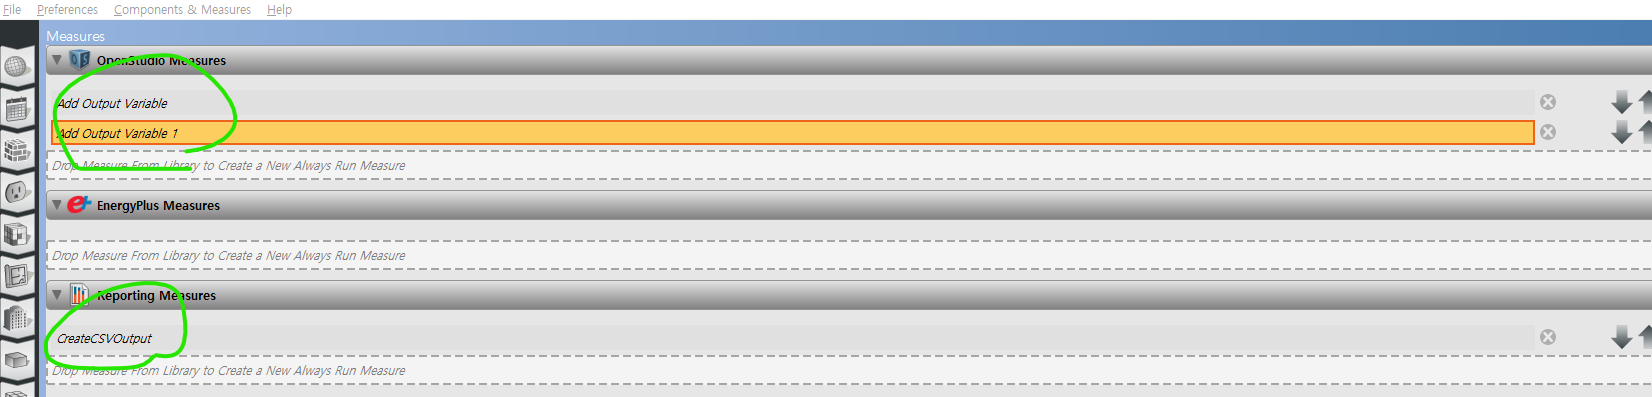
Hi Jack. I use the measure "CreateCSVOutput" in the BLC library to get a .csv file which is placed in the run folder after every simulationrun with all the variable data output. Then I use a python script to graph the data in my webbrowser.

Use ChatGPT or Google AIstudio to edit the script to your liking. I hope this helps you somewhat. Good luck.

import pandas as pd import plotly.graph_objs as go import plotly.io as pio import tempfile import webbrowser import os

csv_file = 'report_variables_ZoneTimestep.csv'

df = pd.read_csv(csv_file, parse_dates=['Zone Timestep'], index_col='Zone Timestep')

exclude_cols = [ 'e:Electricity:Facility[J]' ]

def is_power_variable(col_name: str) -> bool: keywords = ['[w]', '(w)', ' watt', 'power', 'rate', 'elec'] return any(k.lower() in col_name.lower() for k in keywords)

available_cols = [c for c in df.columns if c not in exclude_cols]

left_cols = [c for c in available_cols if not is_power_variable(c)] right_cols = [c for c in available_cols if is_power_variable(c)]

fig = go.Figure()

for col in left_cols: fig.add_trace(go.Scatter(x=df.index, y=df[col], mode='lines', name=col, yaxis='y1'))

for col in right_cols: fig.add_trace(go.Scatter(x=df.index, y=df[col], mode='lines', name=col, yaxis='y2'))

fig.update_layout( title='All Variables from CSV', xaxis_title='Time', yaxis=dict( title='Temperature [Celsius]', side='left', showgrid=False, autorange=True ), yaxis2=dict( title='Power [Watt]', overlaying='y', side='right', showgrid=False, autorange=True ), hovermode='x unified', xaxis=dict( rangeselector=dict( buttons=list([ dict(count=1, label='1 day', step='day', stepmode='backward'), dict(count=7, label='1 week', step='day', stepmode='backward'), dict(count=1, label='1 month', step='month', stepmode='backward'), dict(step='all') ]) ), rangeslider=dict(visible=True), type='date' ) )

with tempfile.NamedTemporaryFile('w', delete=False, suffix='.html', encoding='utf-8') as f: html_str = pio.to_html(fig, include_plotlyjs='cdn', full_html=True, config={'displaylogo': False}) f.write(html_str) temp_path = f.name

webbrowser.open('file://' + os.path.realpath(temp_path)) print("Base plot opened in browser. Axis scaling now uses default Plotly autorange.")

edit flag offensive delete link more

Comments

Thank you Dutchie. Your advice is what I looking for. In additional, python visualization code will be helpful for me. Have great day!

Jack Lee's avatar Jack Lee  ( 2025-11-12 01:46:50 -0600 )edit
0

answered 2025-11-12 02:05:45 -0600

Jack Lee's avatar

Is there a way to add multiple out variables to a single measure? Currently, I'm outputting multiple variables by multiple measures, but is there a way to add them using a different input method?

The picture below shows how I currently get multiple output variables. image description

edit flag offensive delete link more

Comments

Why are you not using the "Output Variables" page? I only use the "Add Output Variable" measure to add variables that are not listed on the Openstudio Output Variables page.

Dutchie's avatar Dutchie  ( 2025-11-12 06:45:03 -0600 )edit

I think my explanation earlier wasn’t clear enough.

Yes, you're right — what I wanted to figure out was how to use the “Add Output Variable” measure to get results that don’t appear on the “Output Variables” page. And in that situation, I was also wondering whether one measure can add multiple output variables at the same time. (As I know, only one variable can be added to one measure.)

That was the main point of my question.

Thanks.

Jack Lee's avatar Jack Lee  ( 2025-11-12 20:37:50 -0600 )edit

Oh I see. Well you can also find the code (somewhere in the program maps of Openstudio I guess) of the measure and ask ChatGPT or Google AIstudio to give you some more input fields. Or maybe even better to ask for a bit of code so you can add multiple variables in the same input field just seperated by a ,

Dutchie's avatar Dutchie  ( 2025-11-14 09:11:13 -0600 )edit

Your Answer

Please start posting anonymously - your entry will be published after you log in or create a new account.

Add Answer

Training Workshops

Question Tools

1 follower

Stats

Asked: 2025-11-11 01:00:49 -0600

Seen: 149 times

Last updated: Nov 12