Site Outdoor Air Drybulb Temperature differed from the one I inputted
Greetings. I just started using OpenStudio one month ago for building heating and cooling load simulations. I work with SketchUp 2024, OpenStudio Application 1.8.0, and EnergyPlus 24.1. I used climate data and selected the weather file "JPN_TK_Tokyo.Intl.AP-Haneda.AP.476710_TMYx.2009-2023," specifying 2019 as the coverage year. I found that the simulation results on outdoor air drybulb temperature were different from the one I inputted.
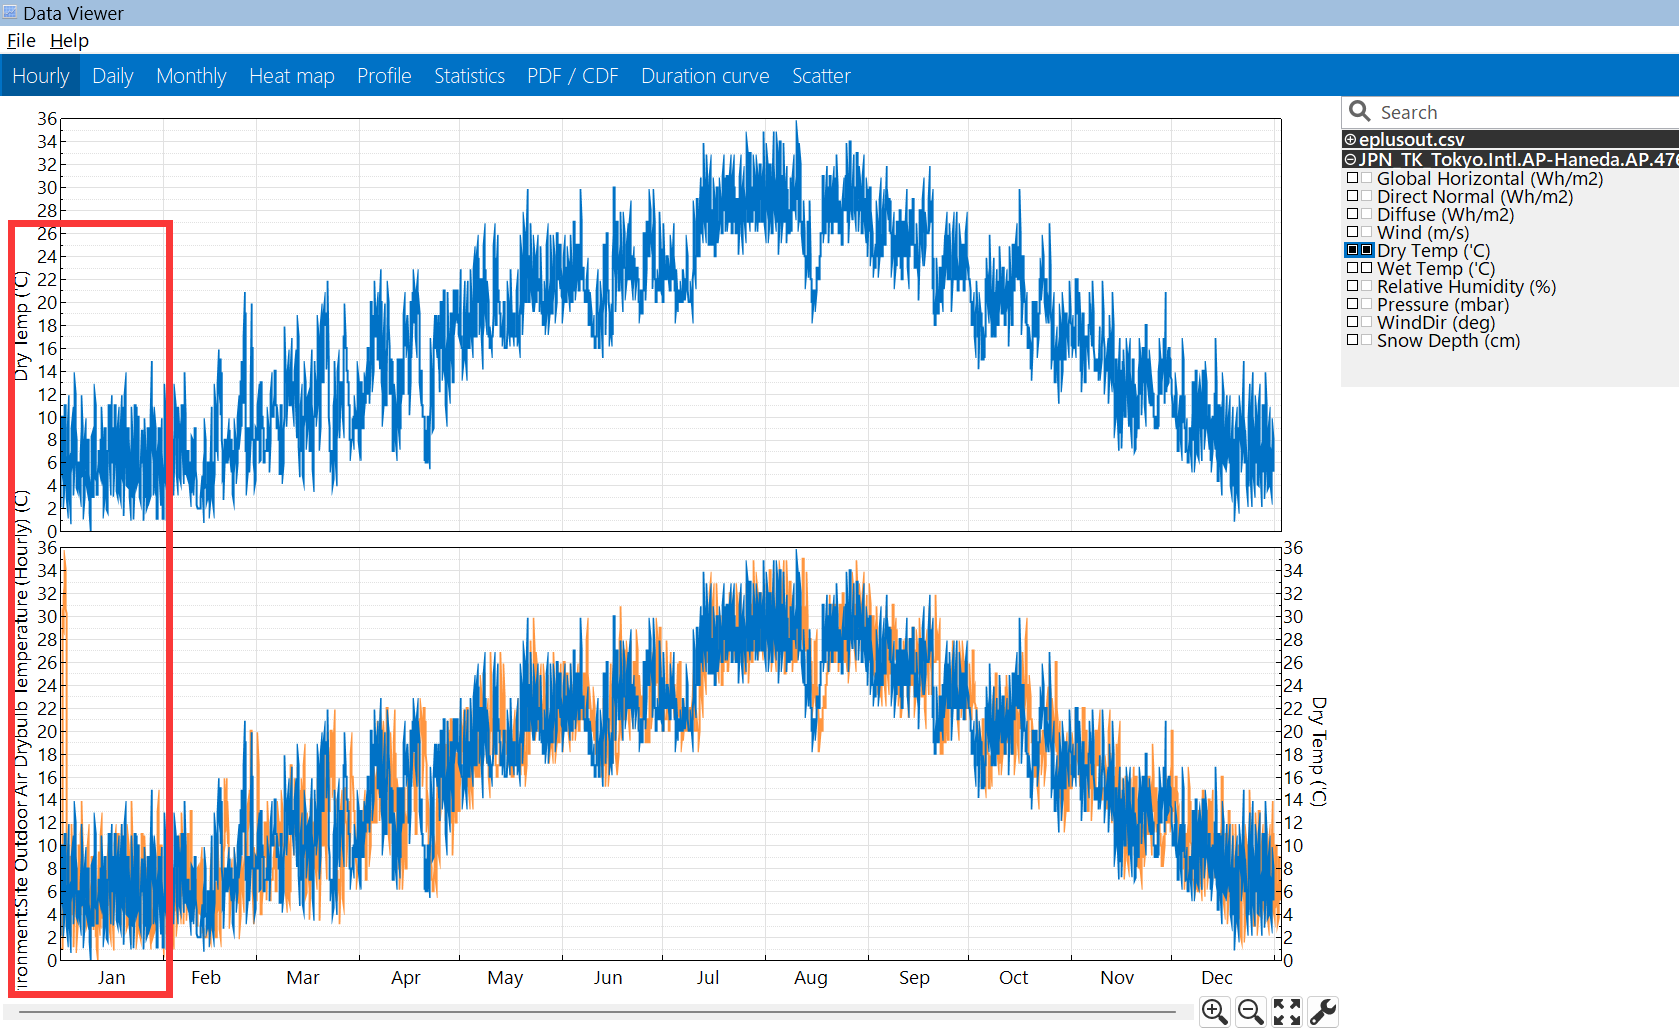
I added an " AddOutputVariable " measure to output the "Site Outdoor Air Drybulb Temperature" and translated the results into a CSV file by ReadVarsESO. However, as shown in the picture, the temperature on June 2 appears unrealistic, and it seems the entire timeline shifted to the right by about three days.
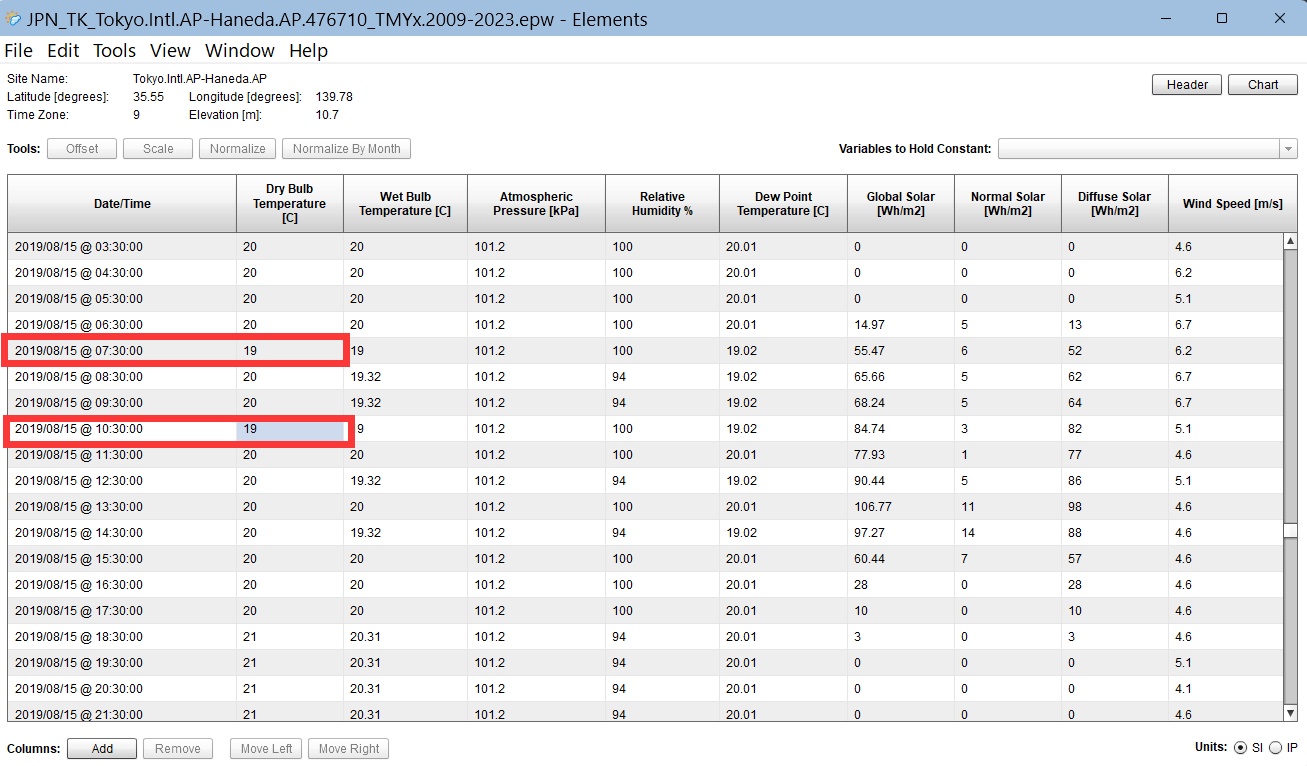
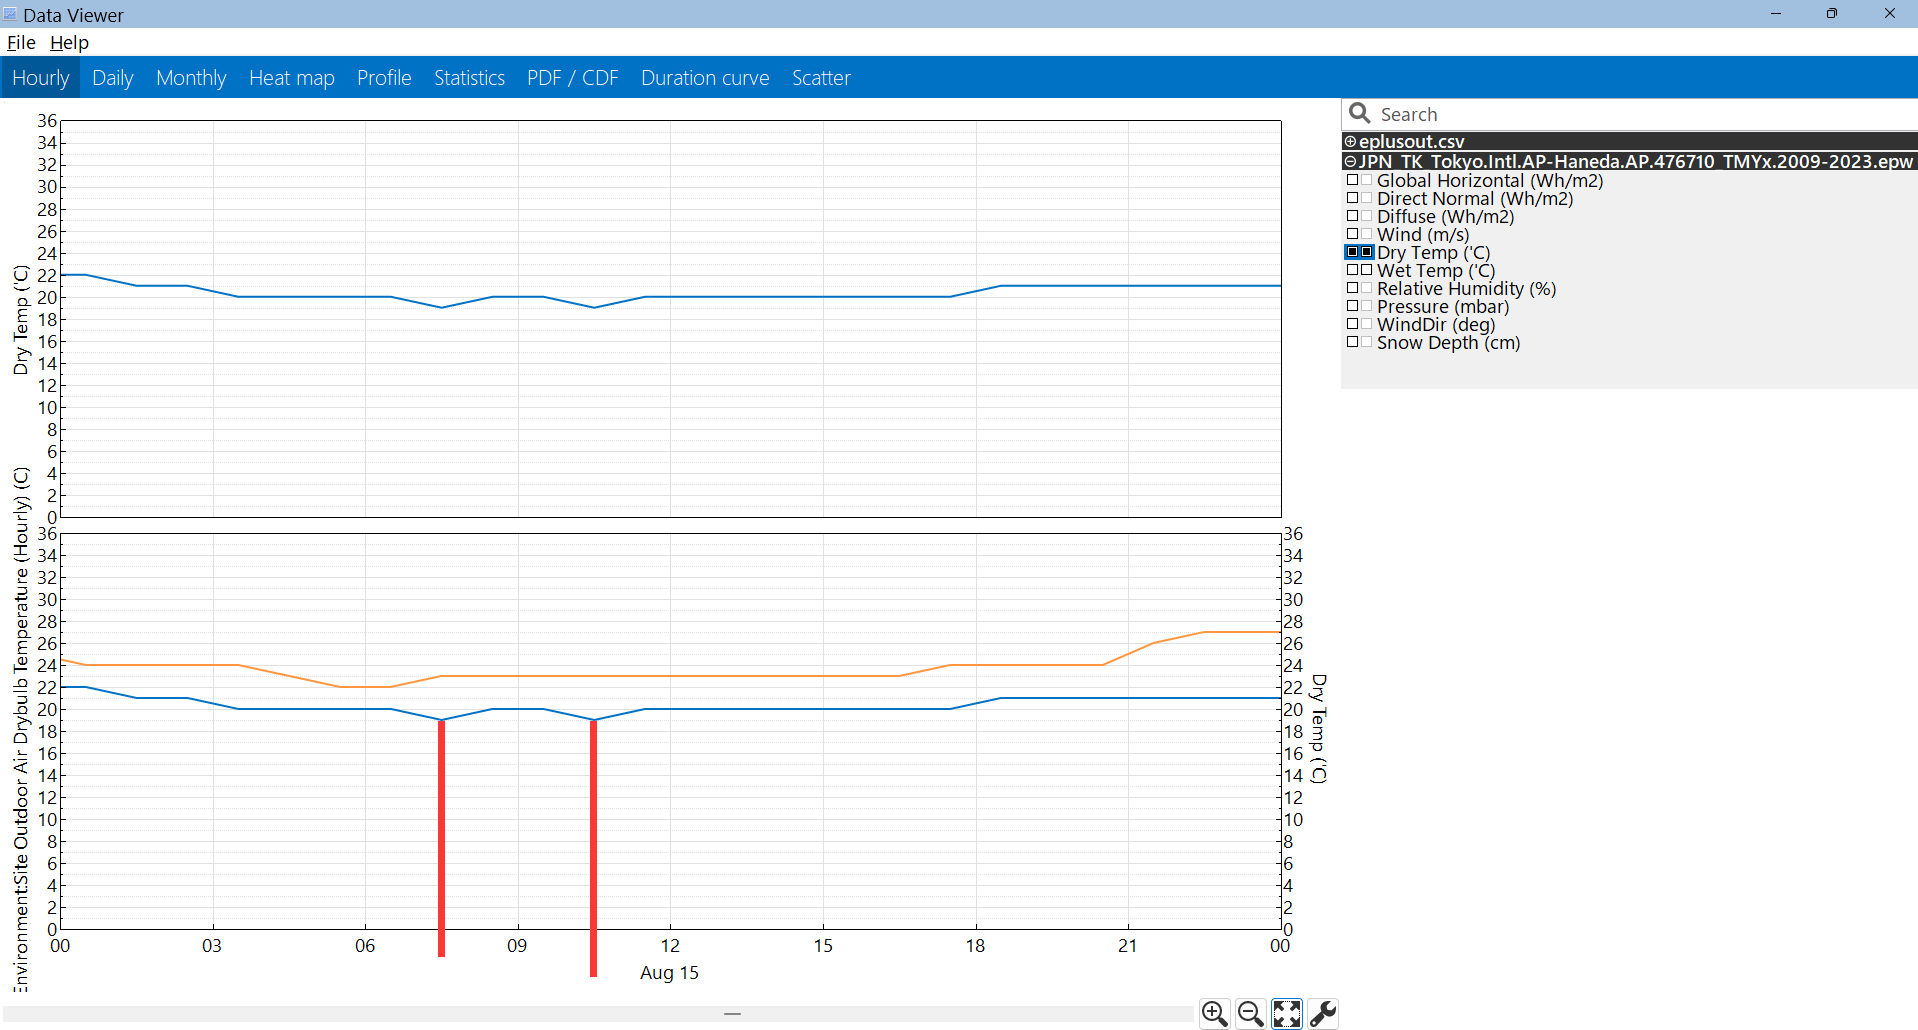
I have checked the EPW file using DView and reviewed the weather-related section of the Input Output Reference for EnergyPlus 24.1. I also checked the introduction of DView, but I still cannot identify the cause of this issue. I used Elements to check the epw file to see if there were any problems, and it kept the same chart as the DView's, so I thought there might be some issues with my os model.
 May somenoe kindly give some ideas which may leads it? I would happily share my model. Any guidance would be greatly appreciated.my model


If you produce a SQL output file from EnergyPlus and open it in DView, I believe it will handle the design days correctly. Whereas if you are providing it a CSV file, DView can't possibly know there are design days so you'd have to remove them yourself.
Thank you for your comment. I opened the sql file with DView, and the display issue still exists. It seems that the summer design day and winter design day data were plotted on the same day as the winter design day, and the unrealistic data came from the summer design day. When I removed the ddy file and only ran the epw, the problem disappeared. My boss prefers that I export all the data outputted as a csv file rather than viewing it directly, so I may export it and draw the charts myself using the csv file. Thank you very much!