Unexplained CO2 dilution with inter-zone air mixing

Hi,
I’m currently observing unexpected CO2 reductions when connecting occupied zones to empty spaces through inter-zone mixing.
I recreated the problem in a simplified model consisting of one occupied room and an empty volume next to it. I tested the model both with and without air mixing, and tried three different sizes for the adjacent volume: 3 m³, 15 m³, and 150 m³. The fresh air enters only through infiltration (no natural or mechanical ventilation).
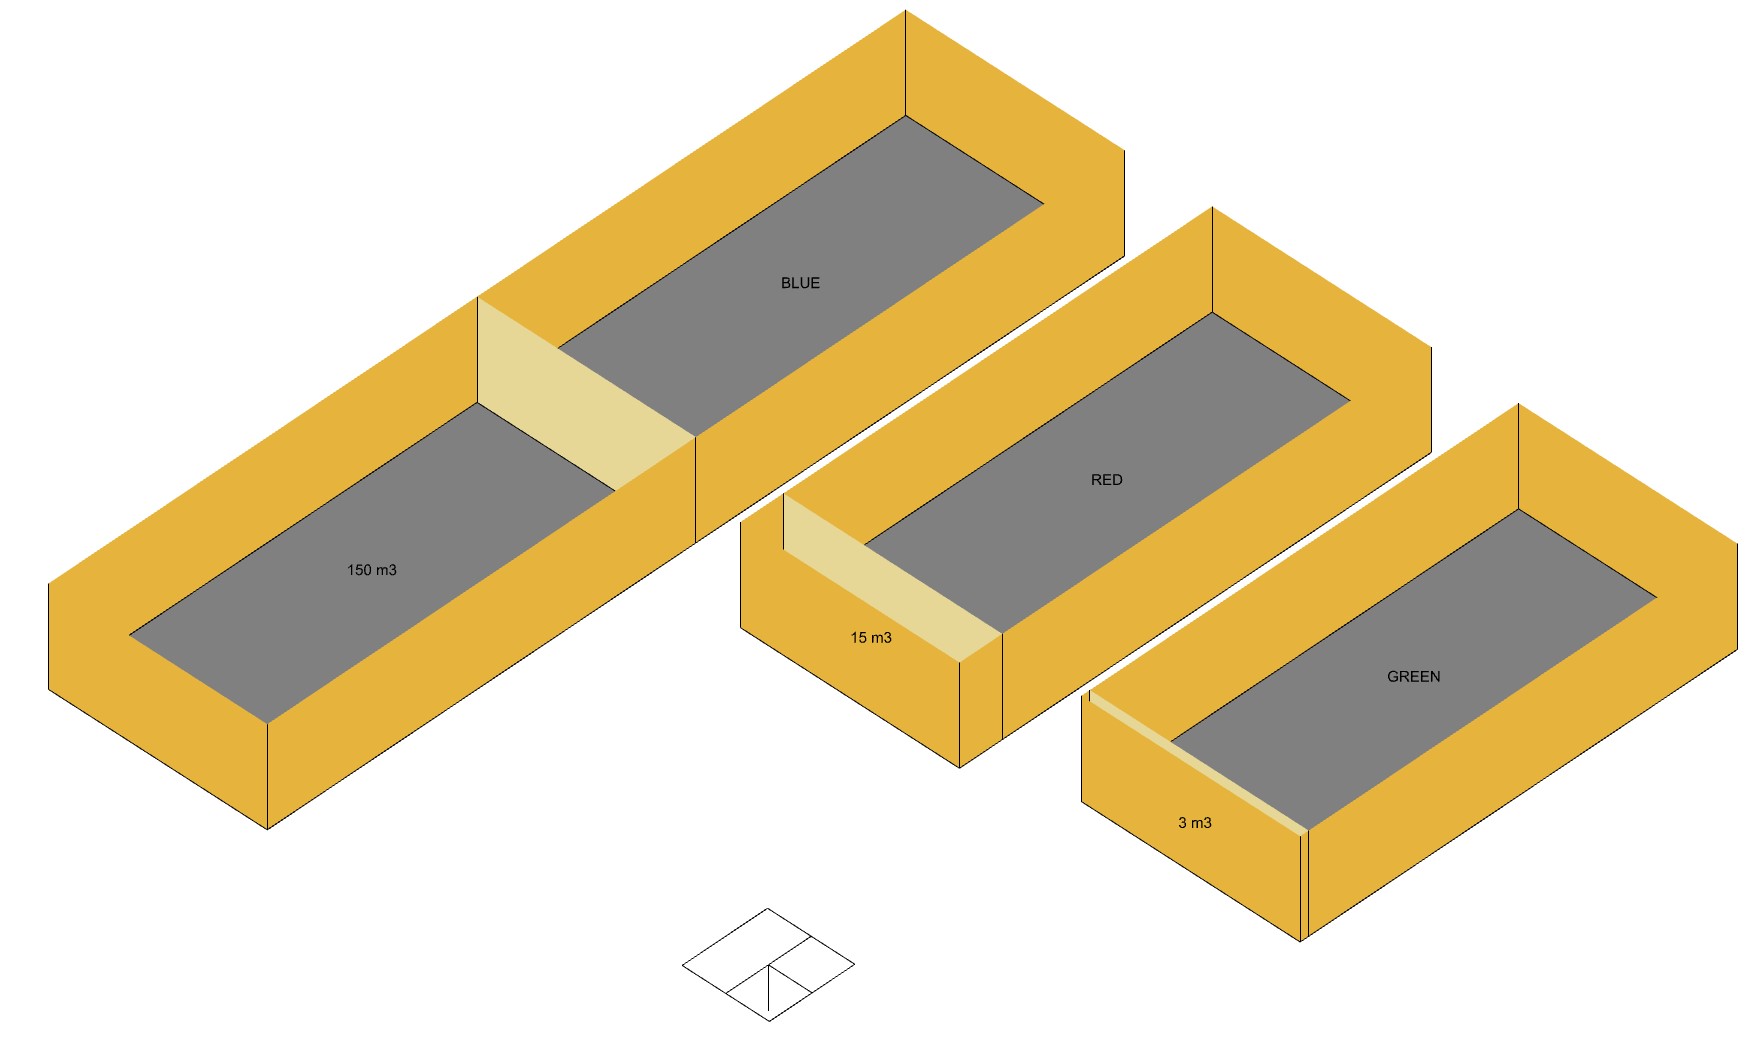
The below chart shows the CO2 concentration in the occupied room on a typical afternoon.
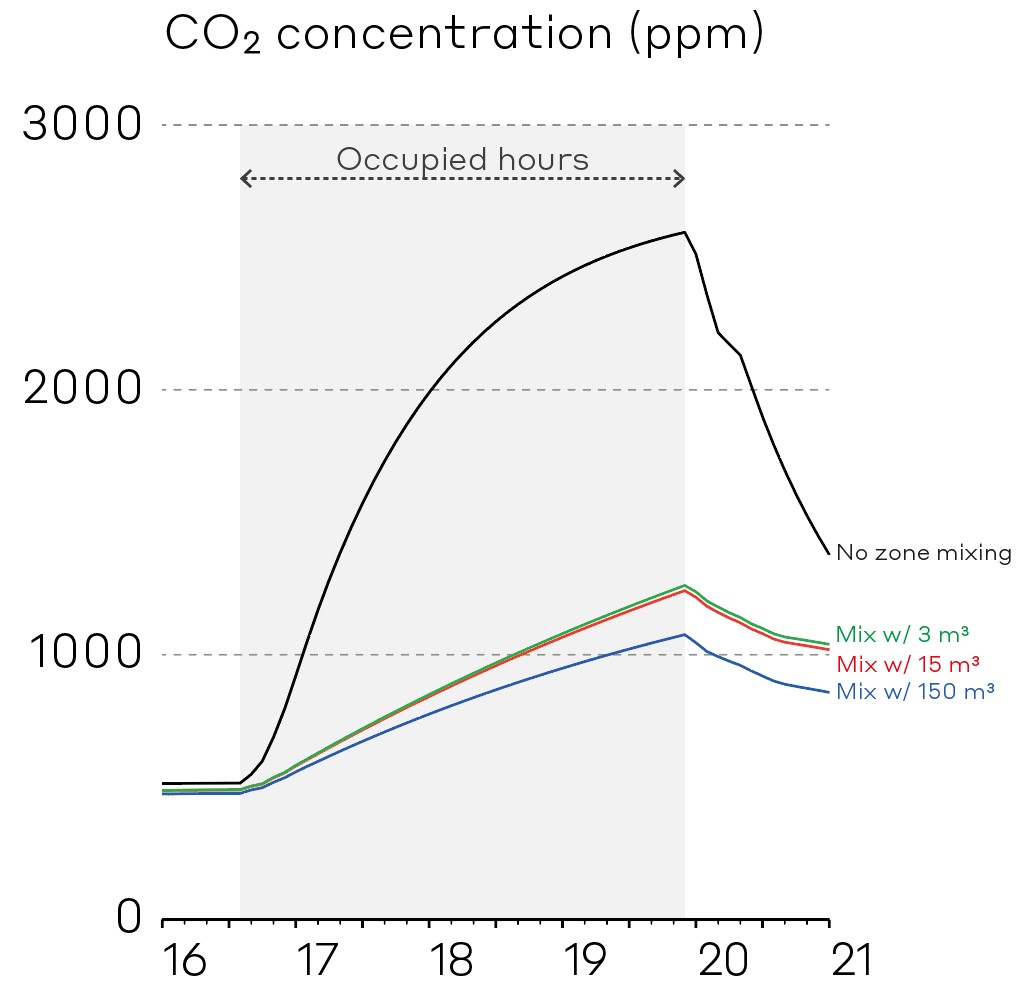
It seems strange to me that the CO2 concentration during occupied hours is highly diluted even when connected to a small fresh air volume (3 m³), and that the differences between 3 m³, 15 m³, and 150 m³ are not as significant as the difference between no air mixing and air mixing with a small volume.
I’m wondering if there might be an issue in how E+ simulates the CO2 transfer between zones, potentially leading to an overestimation of the mixing effect, even if the CO2 transfer due to interzone air mixing seems to be correctly accounted for in the zone air CO2 balance algorithm.
Here's the IDF: idf file
Some additional details:
Tested with EnergyPlus 23.2.0 and 24.2.0 (simulation timestep = 12)
Air mixing tested using both ZoneMixing and ZoneCrossMixing objects (same result)
Similar post: Indoor CO2 variation with inter-zone mixing vs no mixing
Looking for feedback from developers or anyone familiar with the CO2 mixing algorithms under these conditions.


What are the infiltration rate [m3/s] and the outdoor air CO2 concentrtaion [ppm]?
The infiltration rate is 0.0003 m³/s per m² of exterior surface area, and the outdoor air CO2 concentration is set to 450 ppm (constant).
Your chart looks reasonable. I'll answer when I have time.
In brief, I think you should refer to this equetion in Engineering Reference and try to calculate the indoor CO2 concentration at 21:00 (one hour after the occupied hours). The calculated indoor CO2 concentration will be very close to your chart. I have an Excel sheet to calculate it, but unfortunately I can't share it with you.
Thanks for your input. I’m familiar with the equation you’re referring to, but my concern isn’t just about reproducing the CO2 levels at a specific time. My concern is more about how mixing with a small volume drastically reduces CO2 during occupancy, which seems out of proportion to the expected impact. That’s where I think there might be a potential issue with how E+ is simulating the CO2 transfer between zones. Or if you can explain the logic behind this and why the charts seem reasonable, I’d be interested to hear your thoughts.