Question-and-Answer Resource for the Building Energy Modeling Community
| | 1 | initial version |
In your title you refer to an "illuminance map", which is a specific object inherent to OpenStudio and EnergyPlus. In your question you refer to "Radiance and radiosity", which is a ray tracing-based lighting calculation tool (optionally used by OpenStudio), and a lighting calculation algorithm (optionally used by EnergyPlus (but not supported by OpenStudio)), respectively. Your mileage may vary on this answer; please tag (and perhaps revise the title of) your question as appropriate based on the words below...
The illuminance map is merely a grid of points for calculating illuminance in an OpenStudio space/zone. The results can be visualized in the Results Viewer app in OpenStudio, and they do not affect the lighting load reductions (these are calculated based on the signals at the daylighting control point(s).
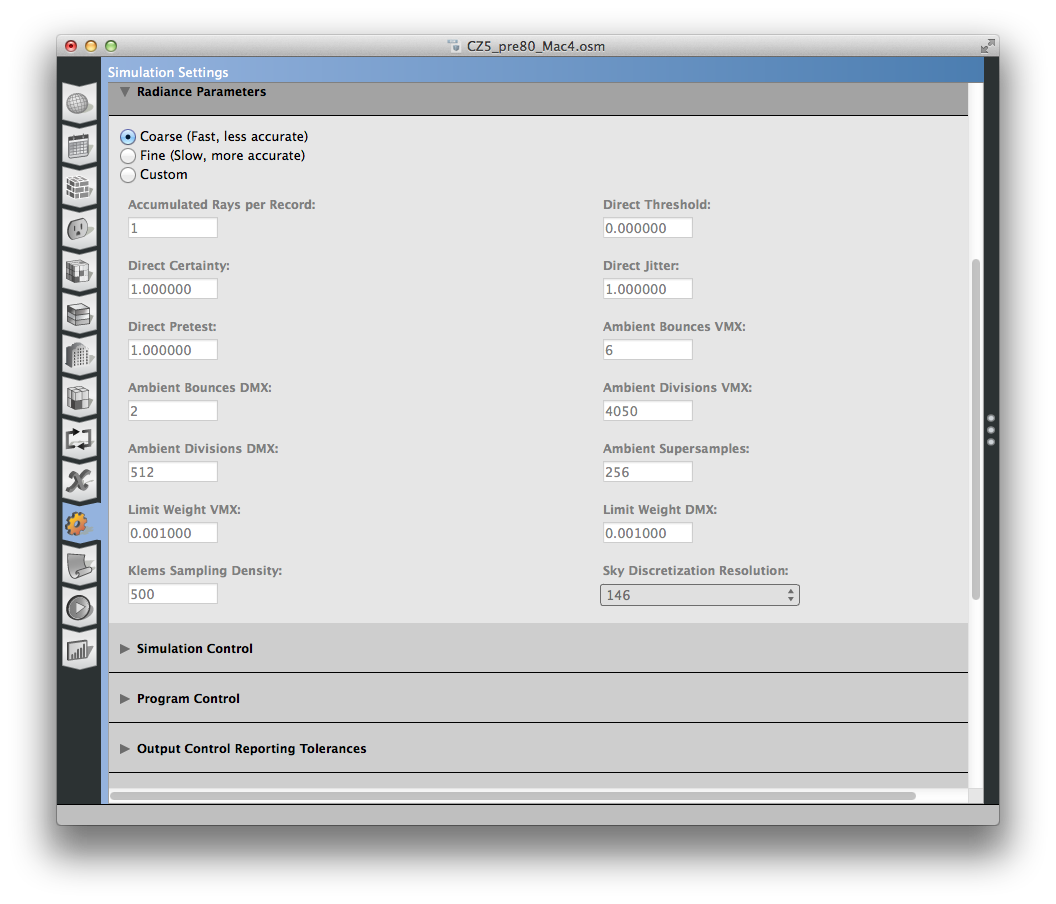
I ASSume by "size of illuminance grid" you mean the point density (column and row spacing). To this, the denser the grid, the better the spatial resolution of your results. The illuminance map density has nothing to do with the rigor or quality/accuracy of the daylight calculation itself. This is dictated by the geometry of the model, and further by the Radiance parameters if Radiance is used as the daylight simulation engine in OpenStudio:
A fine Illuminance Map will show you the spatial distribution of the daylighting better than a coarse one, but of course will take longer to calculate (more points) and the resulting datasets will be larger. As such, they will take up more storage space and will be slower to load. As a point of reference and guidance for point density, the IESNA dictates a maximum of 24" on center spacing for illuminance grid points, when calculating the newish Spatial Daylight Autonomy (sDA) and Annual Sunlight Exposure (ASE) metrics, and is a reasonable default. There is certainly no point in going denser than this if only using EnergyPlus for the daylighting simulations, since EnergyPlus' spatial model is very simple, and its split flux daylighting calculation rather coarse.
HTH!
| | 2 | No.2 Revision |
In your title you refer to an "illuminance map", which is a specific object inherent to OpenStudio and EnergyPlus. In your question you refer to "Radiance and radiosity", which is a ray tracing-based lighting calculation tool (optionally used by OpenStudio), and a lighting calculation algorithm (optionally used by EnergyPlus (but not supported by OpenStudio)), respectively. Your mileage may vary on this answer; please tag (and perhaps revise the title of) your question as appropriate based on the words below...
The illuminance map is merely a grid of points for calculating illuminance in an OpenStudio space/zone. The results can be visualized in the Results Viewer app in OpenStudio, and they do not affect the lighting load reductions (these are calculated based on the signals at the daylighting control point(s).
I ASSume by "size of illuminance grid" you mean the point density (column and row spacing). To this, the denser the grid, the better the spatial resolution of your results. The illuminance map density has nothing to do with the rigor or quality/accuracy of the daylight calculation itself. This is dictated by the geometry of the model, and further by the Radiance parameters if Radiance is used as the daylight simulation engine in OpenStudio:
A fine Illuminance Map will show you the spatial distribution of the daylighting better than a coarse one, but of course will take longer to calculate (more points) and the resulting datasets will be larger. As such, they will take up more storage space and will be slower to load. As a point of reference and guidance for point density, the IESNA dictates a maximum of 24" on center spacing for illuminance grid points, when calculating the newish Spatial Daylight Autonomy (sDA) and Annual Sunlight Exposure (ASE) metrics, metrics (see IESNA LM-82-12), and is a reasonable default. There is certainly no point in going denser than this if only using EnergyPlus for the daylighting simulations, since EnergyPlus' spatial model is very simple, and its split flux daylighting calculation rather coarse.
HTH!

