Question-and-Answer Resource for the Building Energy Modeling Community
| | 1 | initial version |
Hi Rafael,
I ran into a similar problem trying to figure out where these coefficients come from. I have figured out how to generate the coefficients based on a material moisture sorption curve for a given material (as seen in the documents to which you link).
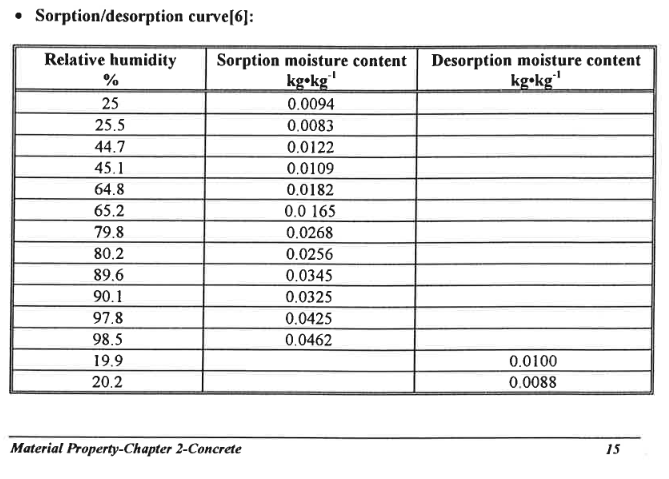
For example, if you look on PDF page 22 of IEA final report volume 3 task 3: material properties (your first link), you'll see a table that lists the moisture soprtion/desportion curve points for concrete at the bottom of the page (I've also put a screen shot of this below). If you take the relative humidity and soprtion moisture content and plot them, you'll see the sorption curve for concrete based on relative humidity. The EMPD coefficients are fitted from this data by running a regression that fits a curve to this data based on the function u= aphi^b + cphi^d where u is the moisture content (the vertical axis values in the sorption curve), phi is the space relative humidity, and a-d are the coefficients that fit the curve to the experimental data. I've expanded on the details found in the engineering reference here: https://bigladdersoftware.com/epx/docs/9-5/engineering-reference/effective-moisture-penetration-depth-empd.html.
So while you probably won't find EMPD coefficients for earth-based constructions, you will likely find moisture sorption curves for them. A regression to fit a non-linear curve to the data can be done in excel (there are several good tutorials on YouTube on the topic), though there are certainly better tools for the job such as Python, MATLAB, or R depending on your experience and familiarity with these tools.
As an example, I have run a regression on the moisture sorption curve for several different types of cross laminated timber (CLT) based on the moisture sorption curve in WUFI for these materials. I used MATLAB and generated the following coefficients for CLT made from Douglas Fir: a = 0.162 b = 0.6695 c = 0.1572 d = 0.9182
I have a plot as well where I compare regressions for different data cut offs. Wood appears to saturate to high moisture contents at relative humidities above 99% so I looked at a range of cutoffs. Those coefficients above come from the regression that ignores the sorption data above 0.3 kg-h20/kg-CLT. This provides a better fit for the sorption curve at relative humidities below about 99%, but is not going to be accurate above that.
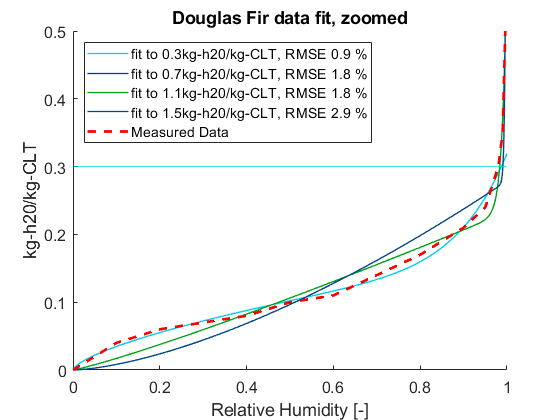
So the light blue line is just a plot of the function u = aphi^b+cphi^d using the above coefficients. I hope this is helpful for the next person to encounter this question!
