Question-and-Answer Resource for the Building Energy Modeling Community
| | 1 | initial version |
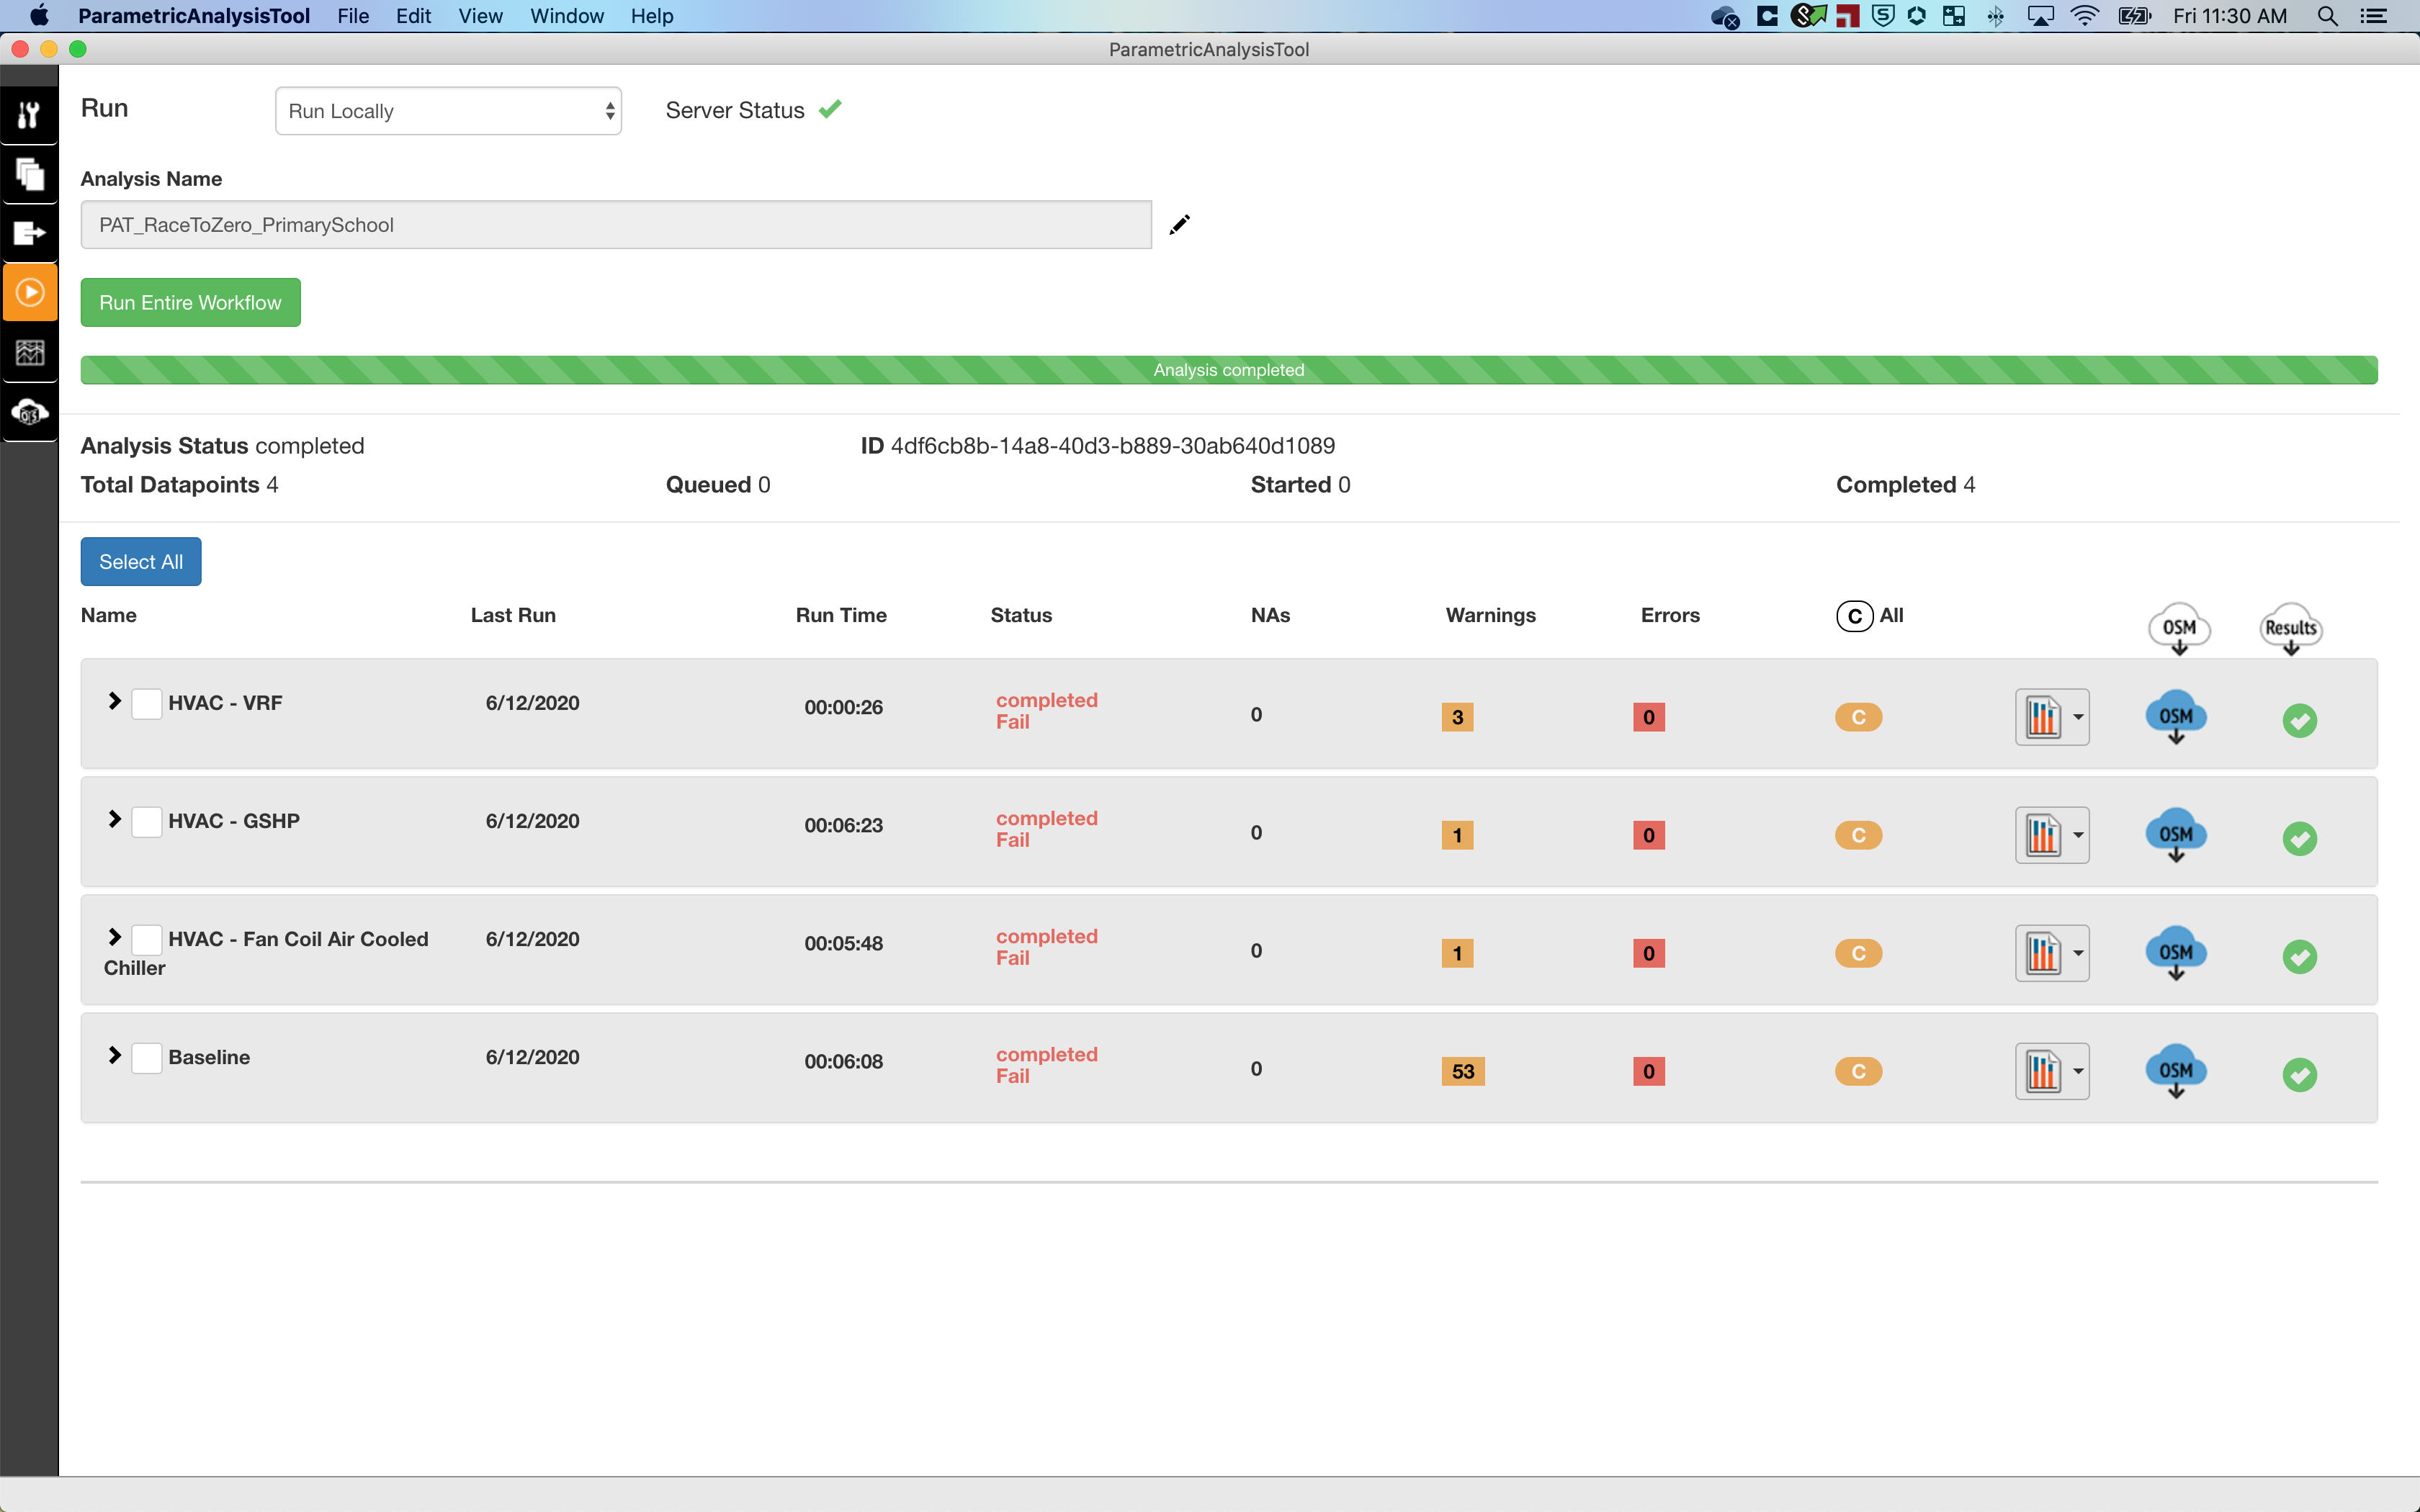
When PAT fails in a measure, for local runs, it gives feedback on which measure failed. EnergyPlus errors are a bit less intuitive. You see an error but if you expand the workflows no measures failed. When you see that, most of the time that means EnergyPlus had a fatal error. It could be a nice enhancement to parse and show this error in the same view as the measure but it doesn't do that now. Below are a few screenshots that might help walk you through the process.
This first shot, looks like yours, it has failed dataponits, and when expanded to look at the measures, there are no errors.
If you go to the last tab in PAT it will take to to a view of the server, which in this case is local. You can also open this in a web browser using the UREL displayed.
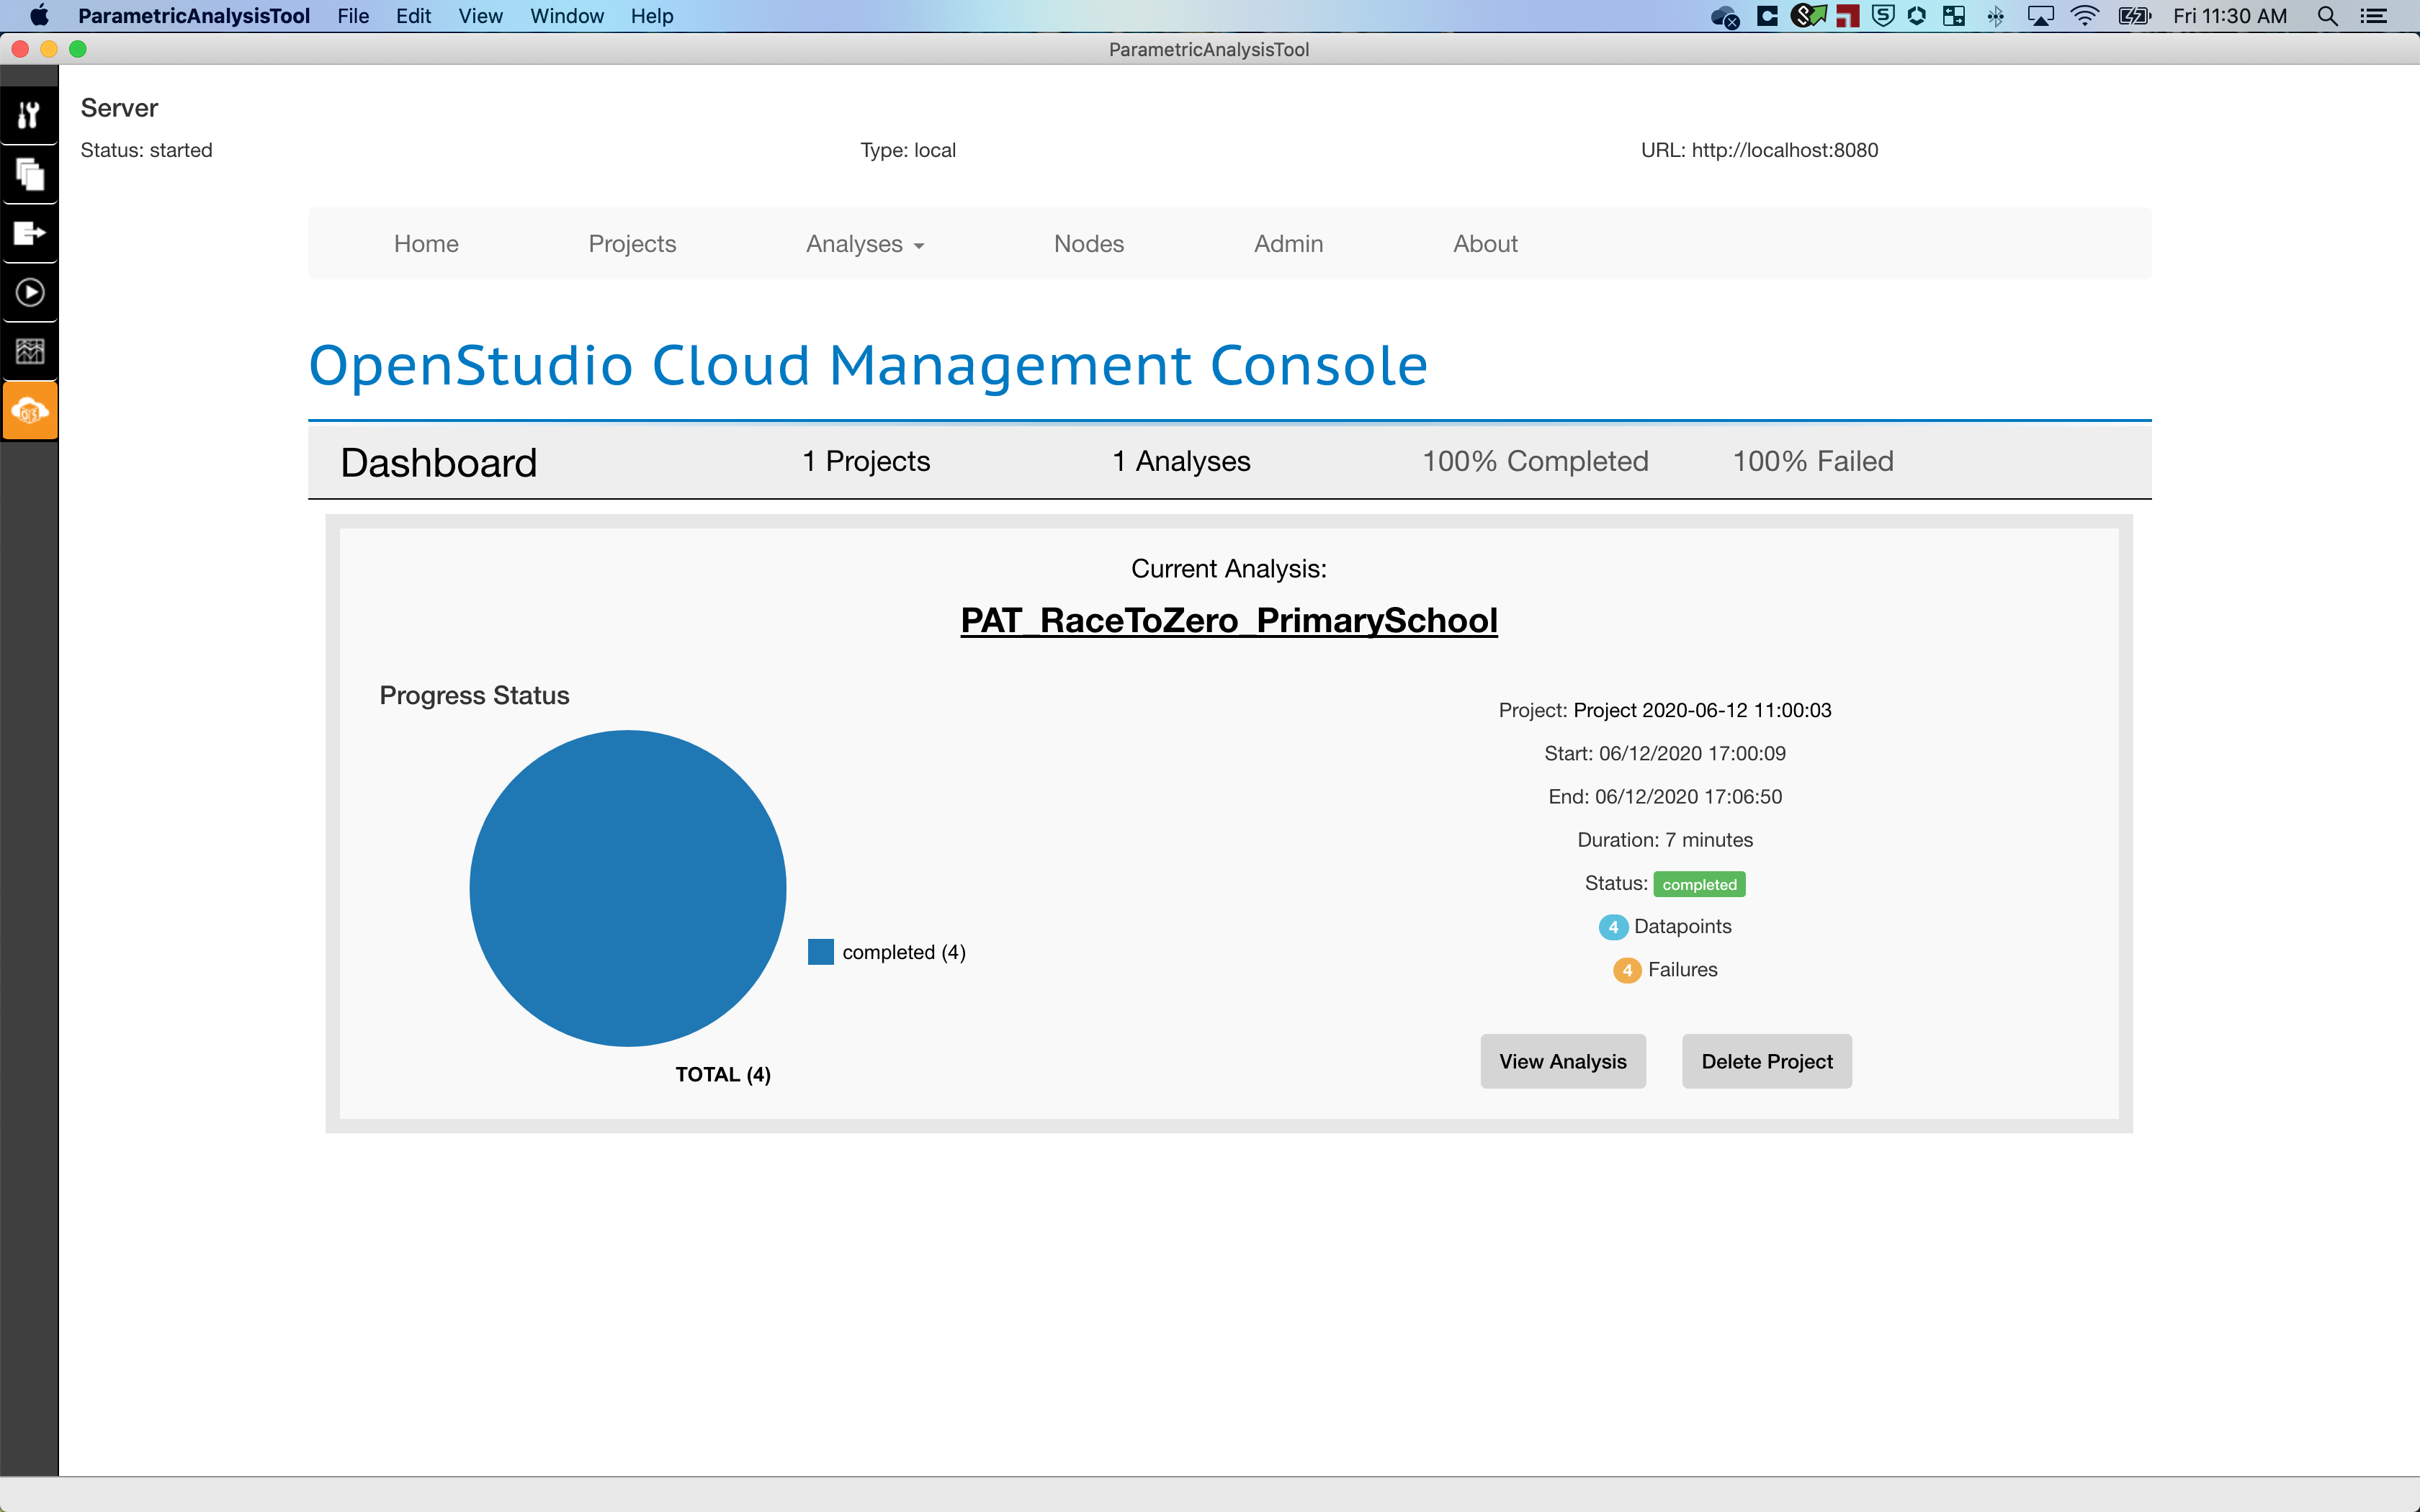
Clicking the current analysis brings up a list of datapoints, shown below.
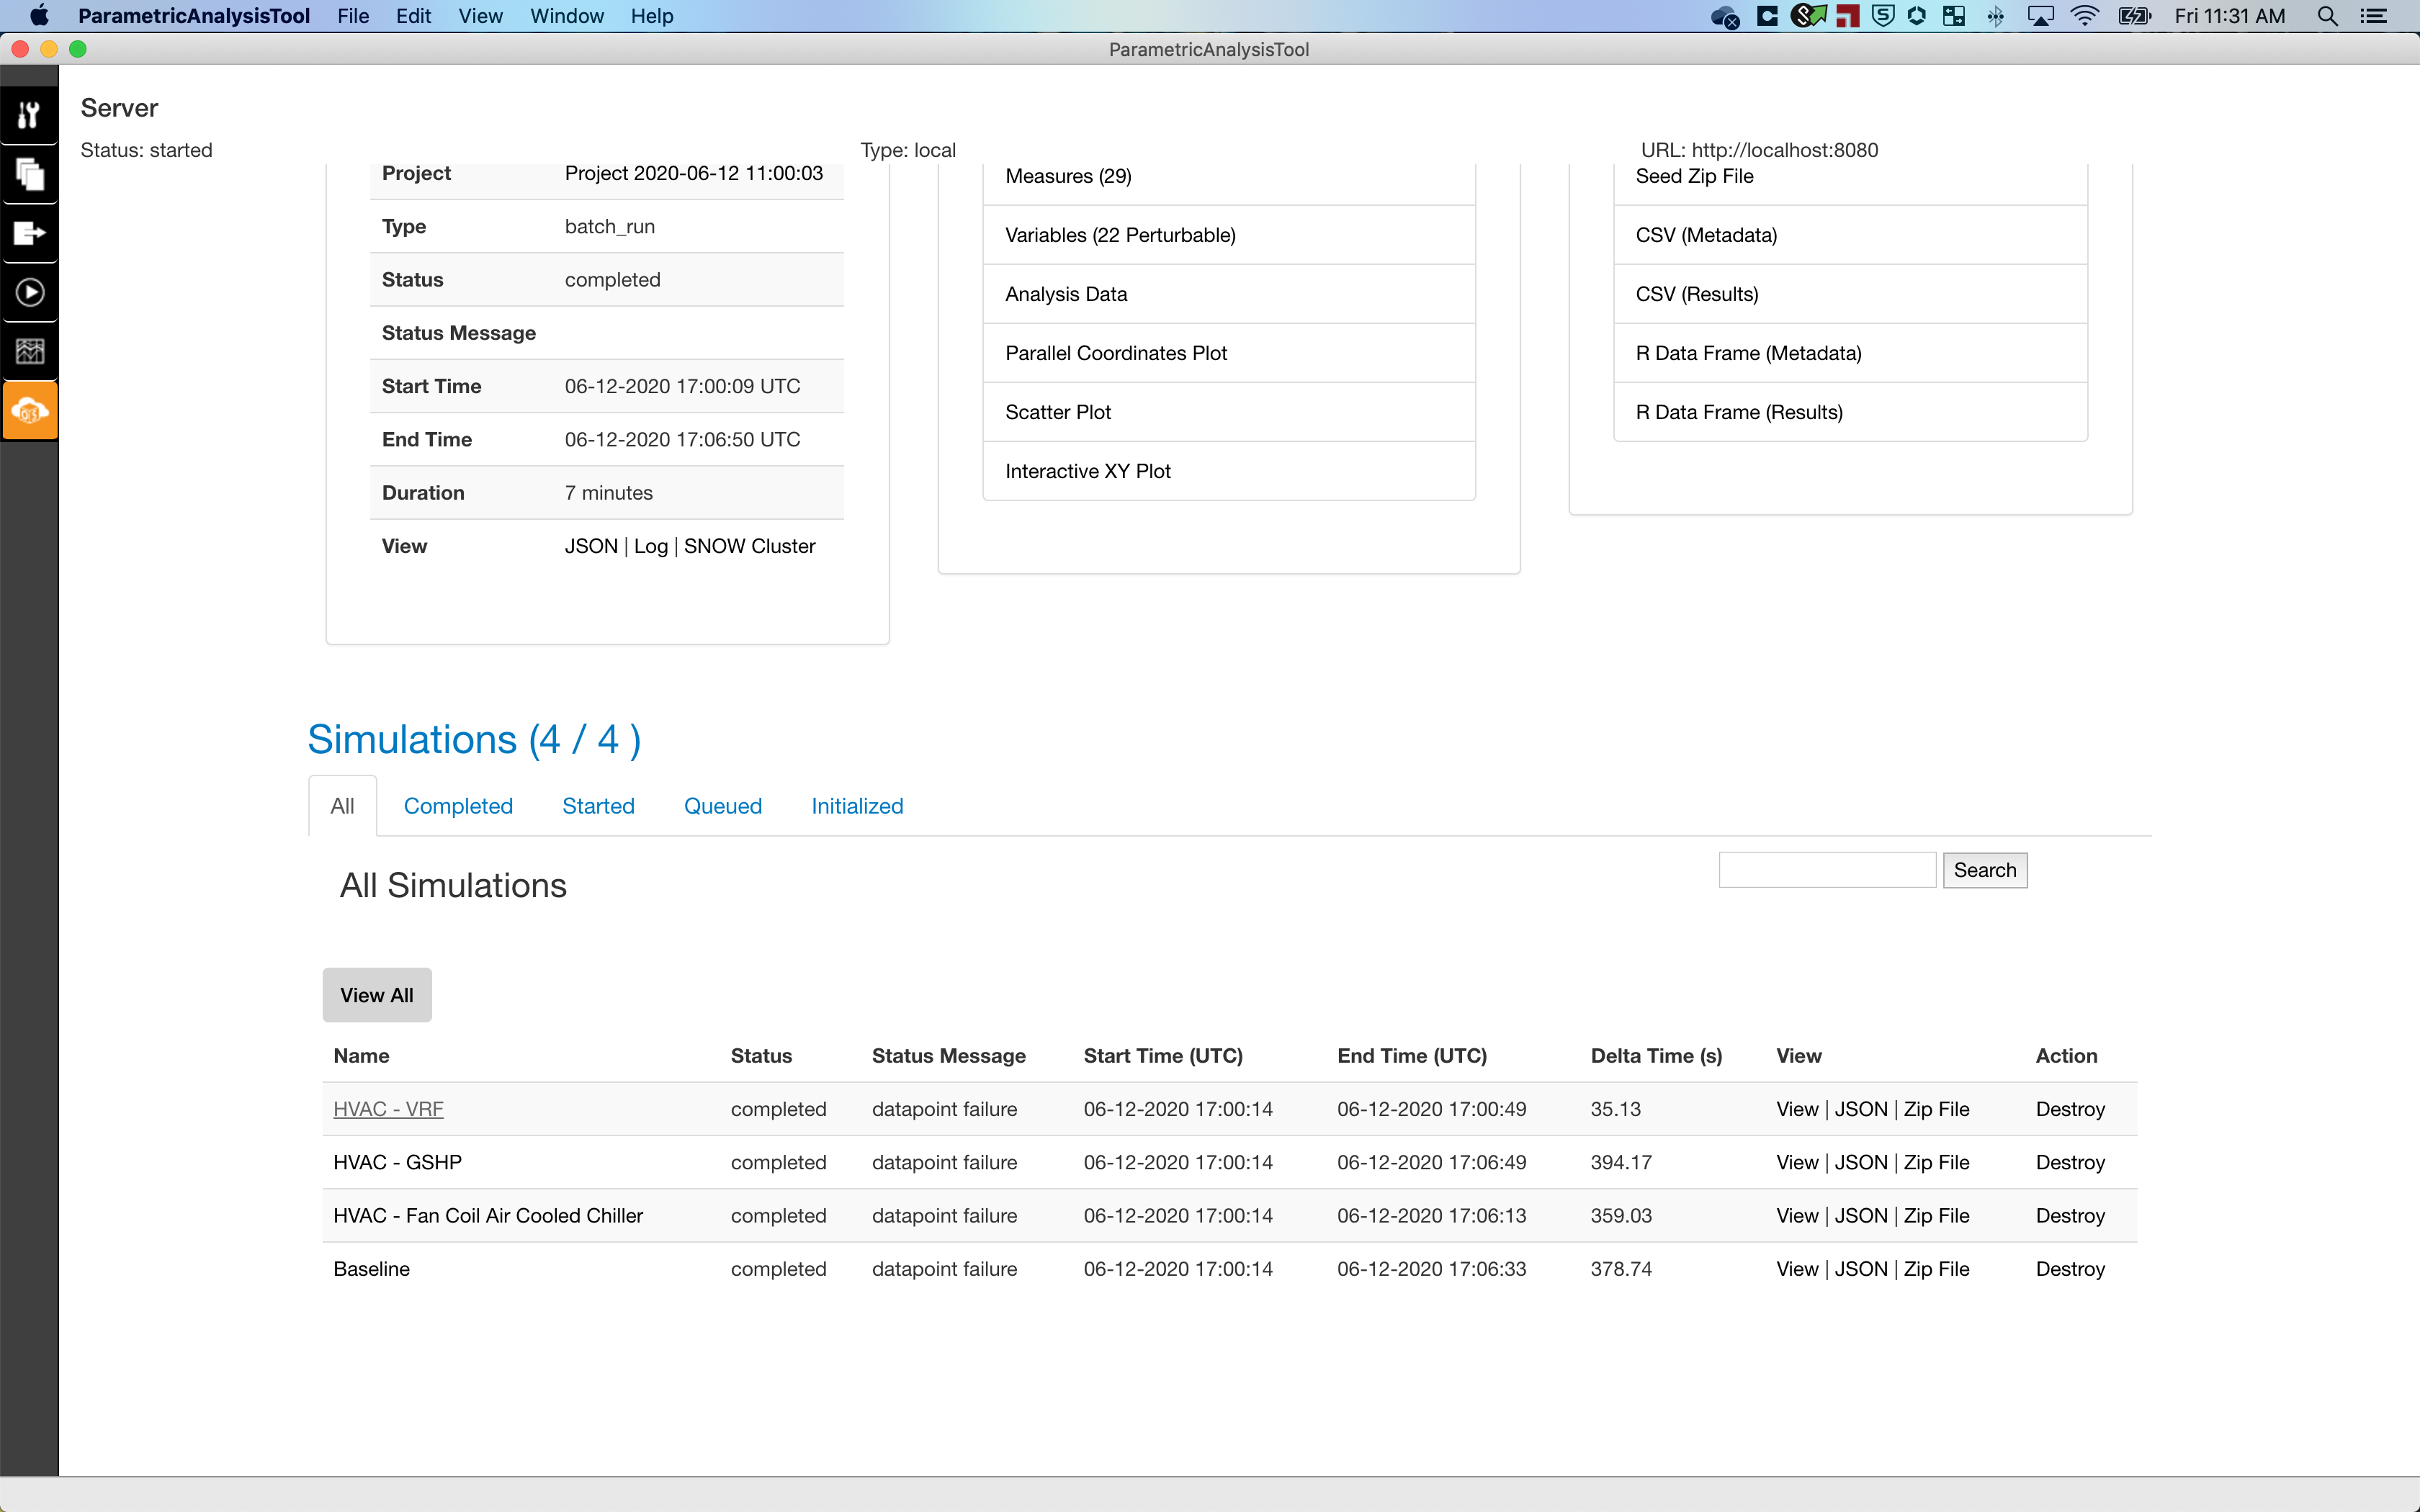
Clicking the name brings up a detail view of that datapiont
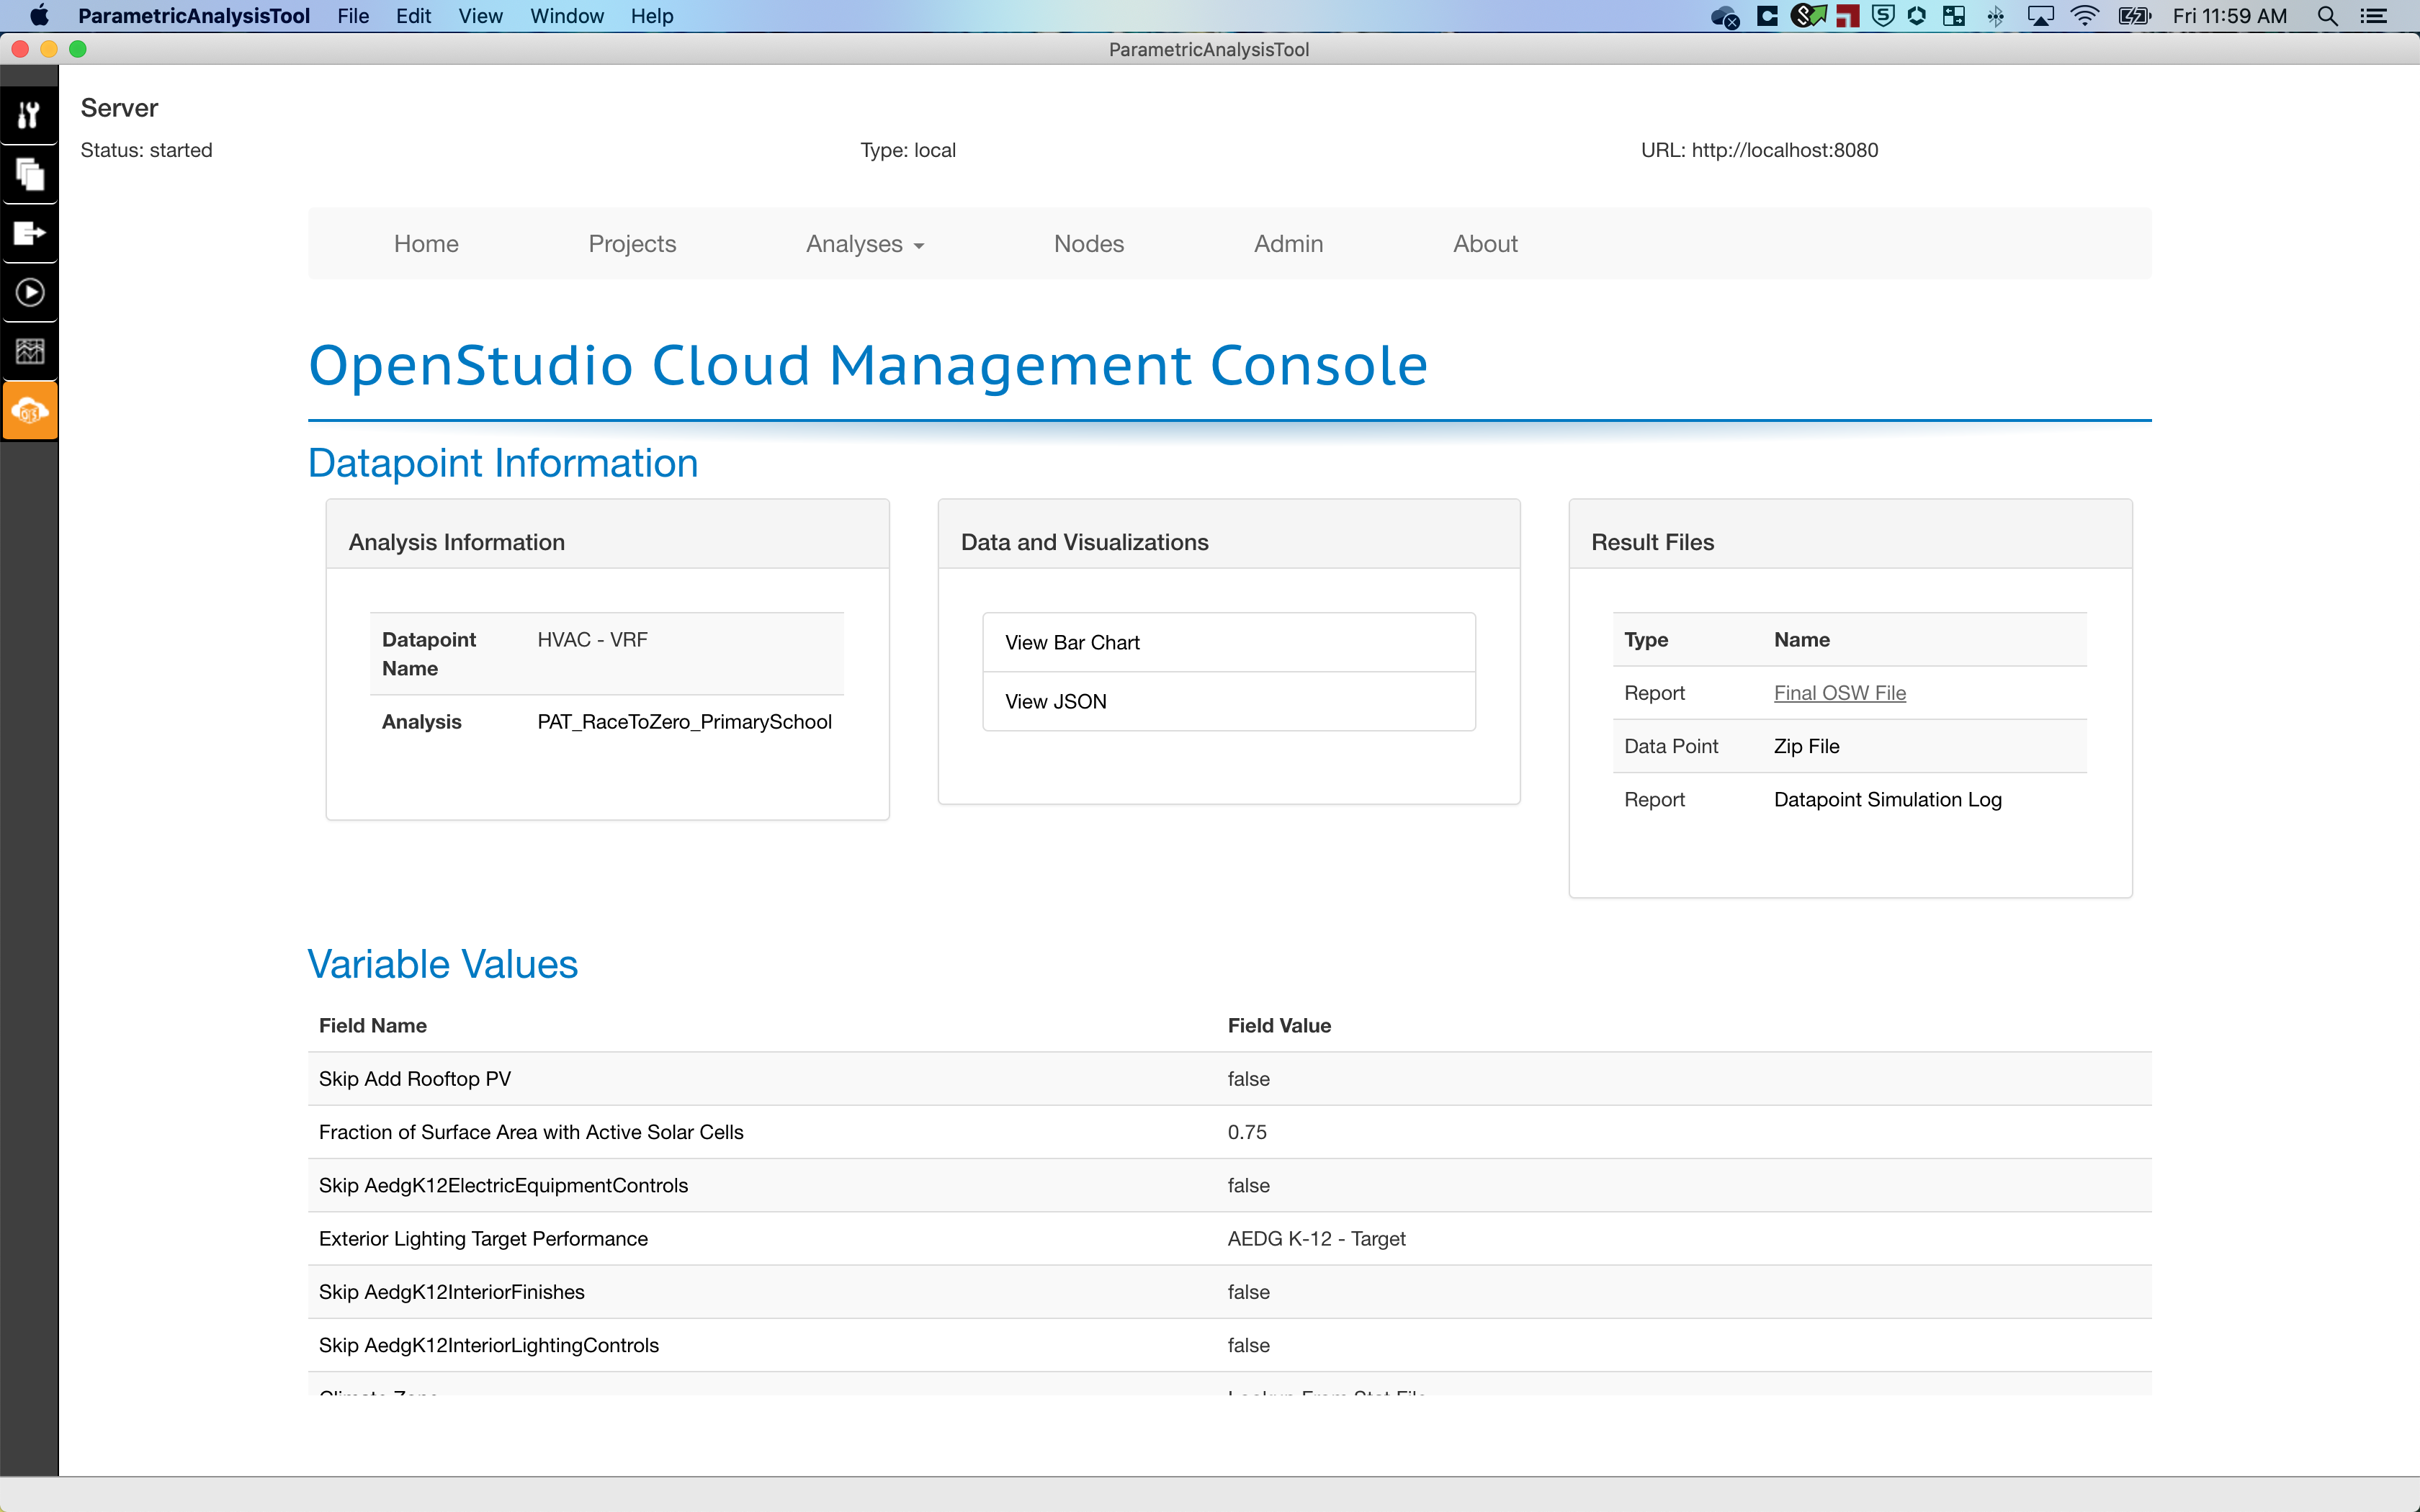
And lastly, clicking the "Final OSW File" link will display the out.OSW file. For reference there is a clean OSW file that just describes the seed model, weather file, and measures. An overloaded copy of that is saved that logs information about the measures and the energy plus run.
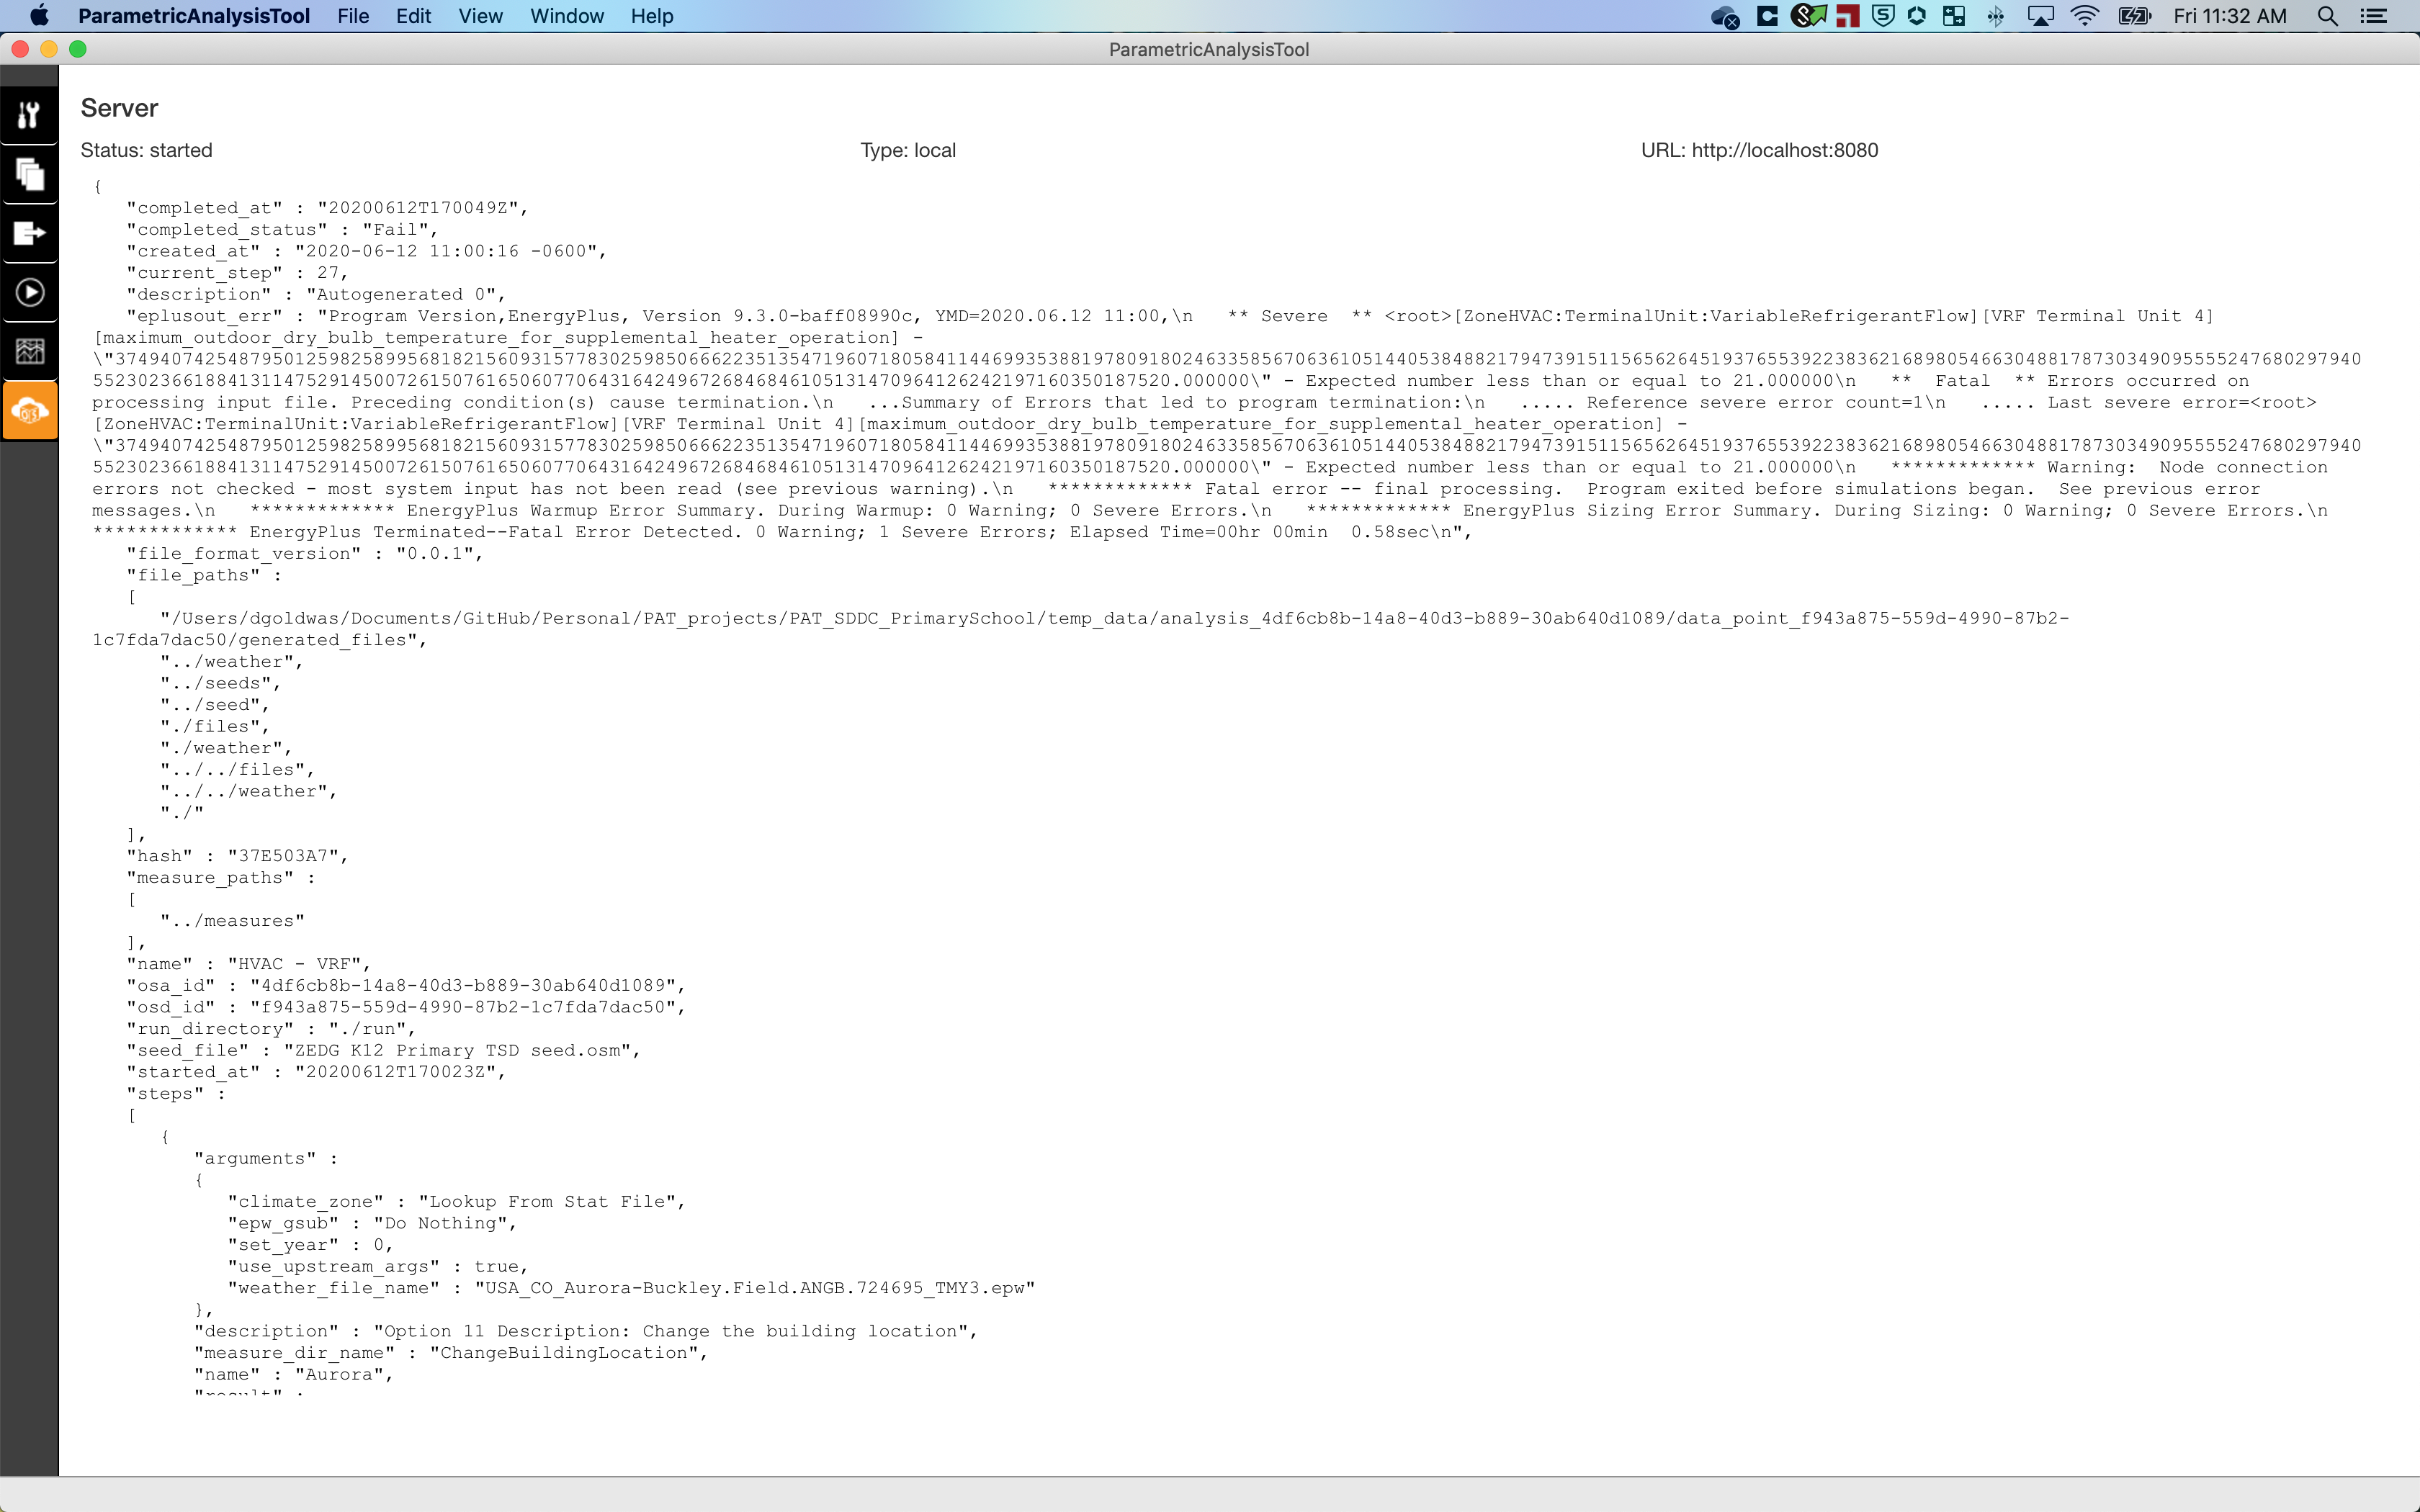
In this case I can see the issue is with a VRF terminal
| | 2 | No.2 Revision |
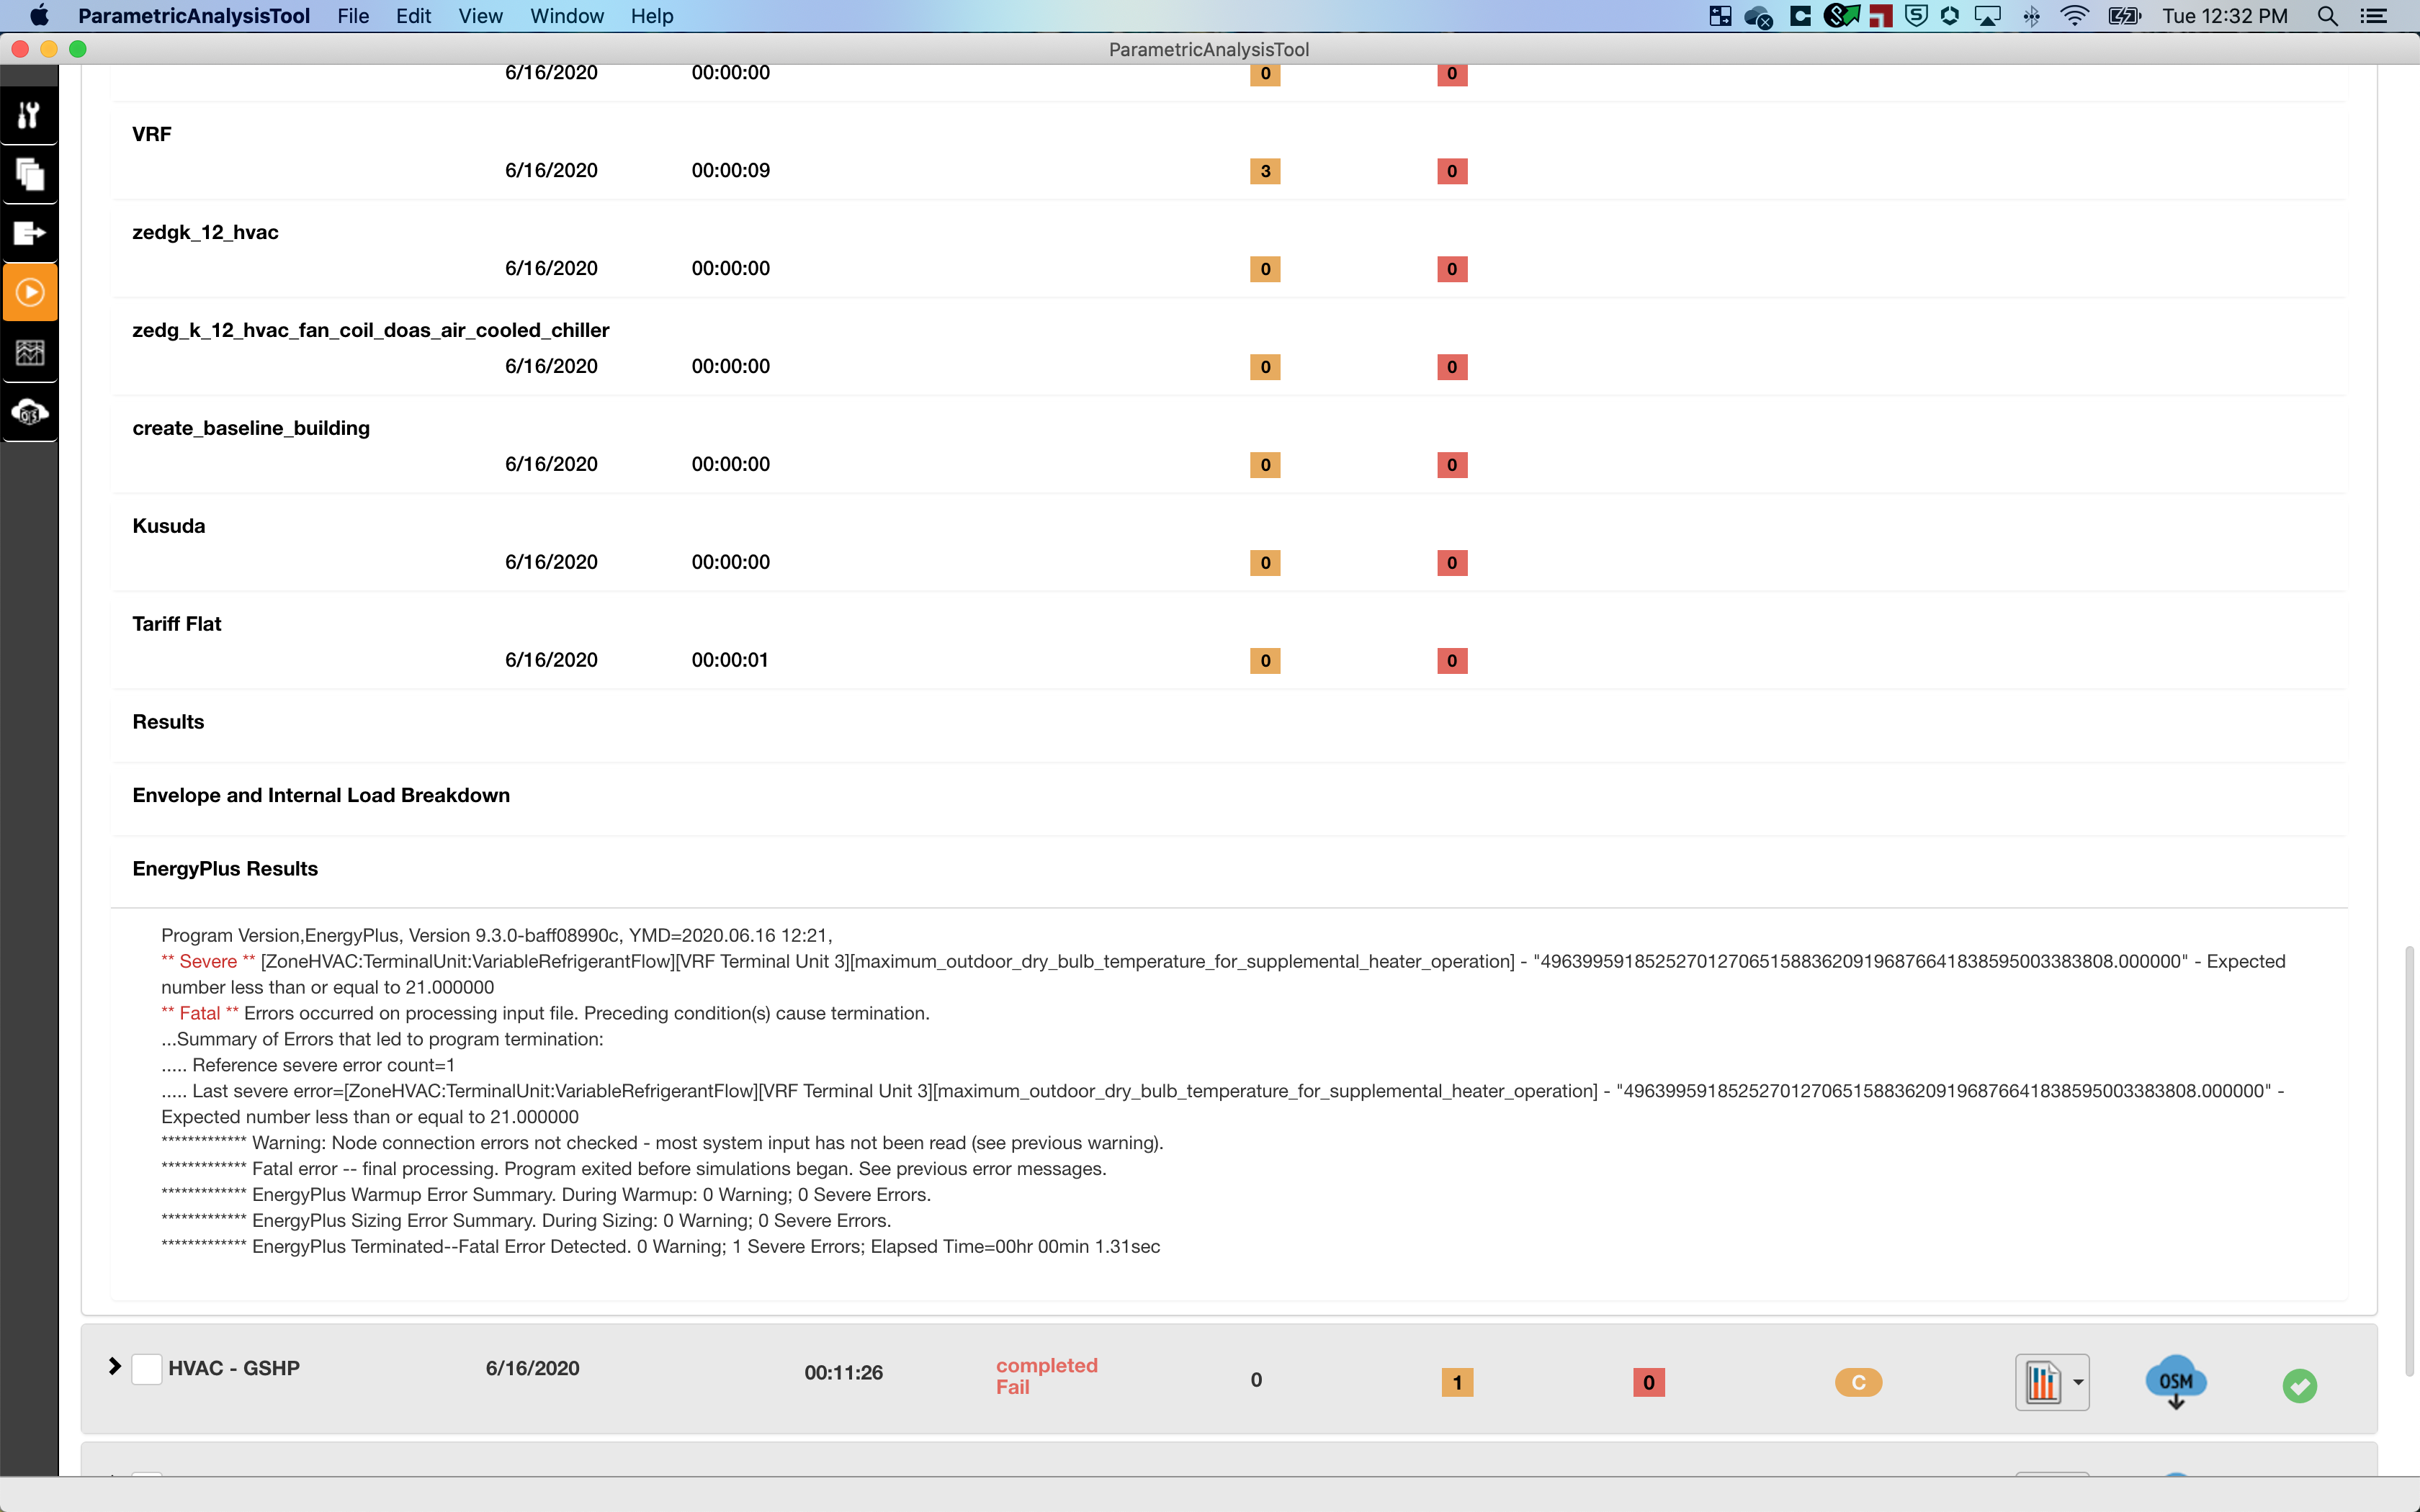
Update: more direct way to see E+ error on most PAT 3.0 is to clicking "EnergyPlus Results" shown below. I'll leave original answer as there are times it is still necessary to see the server JSON file to see why a datapoint failed.
When PAT fails in a measure, for local runs, it gives feedback on which measure failed. EnergyPlus errors are a bit less intuitive. You see an error but if you expand the workflows no measures failed. When you see that, most of the time that means EnergyPlus had a fatal error. It could be a nice enhancement to parse and show this error in the same view as the measure but it doesn't do that now. Below are a few screenshots that might help walk you through the process.
This first shot, looks like yours, it has failed dataponits, and when expanded to look at the measures, there are no errors.
If you go to the last tab in PAT it will take to to a view of the server, which in this case is local. You can also open this in a web browser using the UREL displayed.
Clicking the current analysis brings up a list of datapoints, shown below.
Clicking the name brings up a detail view of that datapiont
And lastly, clicking the "Final OSW File" link will display the out.OSW file. For reference there is a clean OSW file that just describes the seed model, weather file, and measures. An overloaded copy of that is saved that logs information about the measures and the energy plus run.
In this case I can see the issue is with a VRF terminal
| | 3 | No.3 Revision |
Update: more direct way to see E+ error on most PAT 3.0 is to clicking "EnergyPlus Results" shown below. I'll leave original answer as there are times it is still necessary to see the server JSON file to see why a datapoint failed.
[original answer below]
When PAT fails in a measure, for local runs, it gives feedback on which measure failed. EnergyPlus errors are a bit less intuitive. You see an error a failed simulation but if you expand the workflows no measures failed. errors. When you see that, most of the time that means EnergyPlus had a fatal error. It could be a nice enhancement to parse and show this error in the same view as the measure but it doesn't do that now. Below are a few screenshots that might help walk you through the process.
This first shot, looks like yours, it has failed dataponits, and when expanded to look at the measures, there are no errors.
If you go to the last tab in PAT it will take to to a view of the server, which in this case is local. You can also open this in a web browser using the UREL displayed.
Clicking the current analysis brings up a list of datapoints, shown below.
Clicking the name brings up a detail view of that datapiont
And lastly, clicking the "Final OSW File" link will display the out.OSW file. For reference there is a clean OSW file that just describes the seed model, weather file, and measures. An overloaded copy of that is saved that logs information about the measures and the energy plus run.
In this case I can see the issue is with a VRF terminal


