Question-and-Answer Resource for the Building Energy Modeling Community
First time here? Check out the Help page!
| | 1 | initial version |
The results will vary depending on the EnergyPlus Model Calling Point input in the EnergyManagementSystem:ProgramCallingManager object. The zone temperature is the temperature at the end of the previous time step.
Most of the calling points will work as:
Read zone temperature from previous time step (your row 5 zone temp or 24.19473)) and make a decision. In this case the EMS decided to open the window. The result of the decision will be the zone temperature in the next time step (your row 6 zone temp or 24.483). Now 24.483 is the new zone temperature.
If you turn on EMS output reporting you can see the results of the EMS code in the edd file.
Output:EnergyManagementSystem,
   Verbose,
   Verbose,
   Verbose;
| | 2 | No.2 Revision |
The results will vary depending on the EnergyPlus Model Calling Point input in the EnergyManagementSystem:ProgramCallingManager object. The zone temperature is the temperature at the end of the previous time step.
Most of the calling points will work as:
Read zone temperature from previous time step (your row 5 zone temp or 24.19473)) and make a decision. In this case the EMS decided to open the window. The result of the decision will be the zone temperature in the next time step (your row 6 zone temp or 24.483). Now 24.483 is the new zone temperature.
If you turn on EMS output reporting you can see the results of the EMS code in the edd file.
Output:EnergyManagementSystem,
   Verbose,
   Verbose,
   Verbose;
When reviewing the edd results of the simulation, which describes in detail the results of each line of EMS code, there are several sections of output. The first information is related to EMS code results for the warmup period. This information is good for determining if the code is working as expected but results may be different than the actual simulation since the model is in warmup mode. Note the occurance is During Warmup.
Example:
****  Begin EMS Language Processor Error and Trace Output  ***
<Erl program name, line #, line text, result, occurance timing information ... >
CURVEOVERWRITEMGR,Line 1,SET TTMP = COILINLETDBT,0.0, During Warmup, Occurrence info=MIAMI INTL AP ANN HTG 99.6% CONDNS DB, 01/21 00:00 - 00:15
CURVEOVERWRITEMGR,Line 2,SET WTMP = COILINLETW,0.0, During Warmup, Occurrence info=MIAMI INTL AP ANN HTG 99.6% CONDNS DB, 01/21 00:00 - 00:15
The next section describes the available actuators. This section is turned on a off and organized via the Output:EnergyManagementSystem input for Actuator Availability Dictionary Reporting.
! <EnergyManagementSystem:Actuator Available>, Component Unique Name, Component Type,  Control Type, Units
EnergyManagementSystem:Actuator Available,Environment,Weather Data,Outdoor Dry Bulb,[C]
EnergyManagementSystem:Actuator Available,ACTIVITY SCH,Schedule:Compact,Schedule Value,[ ]
The next section is a description of the internal variables and is similarly control via the Output:EnergyManagementSystem input for Internal Variable Availability Dictionary Reporting.
! <EnergyManagementSystem:InternalVariable Available>, Unique Name, Internal Data Type, Units
EnergyManagementSystem:InternalVariable Available,HOT WATER LOOP,Plant Design Volume Flow Rate,[m3/s]
EnergyManagementSystem:InternalVariable Available,WEST ZONE,People Count Design Level,[each]
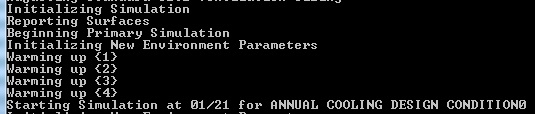
Following this section is more warmup period results and repeat depending on how many warmup period are required for the specific simulation to find convergence before beginning the actual simulation. This figure below shows several warmup period prior to the actual simulation.
When the warmup periods have completed the EMS results for the actual simulation will be reported. Shown below is the final warmup period report, including the occurance description of During Warmup. Note the time stamp for EMS code lines 16 through 20 show times of 23:45 - 24:00. When the program executes again, the occurance info does not include the During Warmup descriptor. This is the result of the actual simulation starting at time 00:00 - 00:15 at the first line of EMS code in order of program execution.
CURVEOVERWRITEMGR,Line 16,SET CURVEINPUT2 = CURVEINPUT,1.110623, During Warmup, Occurrence info=MIAMI INTL AP ANN HTG 99.6% CONDNS DB, 01/21 23:45 - 24:00
CURVEOVERWRITEMGR,Line 17,IF OAT > 31.0,0.0, During Warmup, Occurrence info=MIAMI INTL AP ANN HTG 99.6% CONDNS DB, 01/21 23:45 - 24:00
CURVEOVERWRITEMGR,Line 19,ENDIF,, During Warmup, Occurrence info=MIAMI INTL AP ANN HTG 99.6% CONDNS DB, 01/21 23:45 - 24:00
CURVEOVERWRITEMGR,Line 20,SET CURVEOVERWRITE = CURVEINPUT,1.110623, During Warmup, Occurrence info=MIAMI INTL AP ANN HTG 99.6% CONDNS DB, 01/21 23:45 - 24:00
CURVEOVERWRITEMGR,Line 1,SET TTMP = COILINLETDBT,21.417543, Occurrence info=MIAMI INTL AP ANN HTG 99.6% CONDNS DB, 01/21 00:00 - 00:15
CURVEOVERWRITEMGR,Line 2,SET WTMP = COILINLETW,6.847167E-003, Occurrence info=MIAMI INTL AP ANN HTG 99.6% CONDNS DB, 01/21 00:00 - 00:15
The report includes warmup days if selected and the weather file simulation as described in the SimulationControl object. To reduce the amount of output and review only the results of the weather file simulation, select No for Run Simulation for Sizing Periods.
SimulationControl,
  Yes,                     !- Do Zone Sizing Calculation
  No,                      !- Do System Sizing Calculation
  No,                      !- Do Plant Sizing Calculation
  Yes,                     !- Run Simulation for Sizing Periods
  Yes;                     !- Run Simulation for Weather File Run Periods
| | 3 | No.3 Revision |
The results will vary depending on the EnergyPlus Model Calling Point input in the EnergyManagementSystem:ProgramCallingManager object. The zone temperature is the temperature at the end of the previous time step.
Most of the calling points will work as:
Read zone temperature from previous time step (your row 5 zone temp or 24.19473)) and make a decision. In this case the EMS decided to open the window. The result of the decision will be the zone temperature in the next time step (your row 6 zone temp or 24.483). Now 24.483 is the new zone temperature.
If you turn on EMS output reporting you can see the results of the EMS code in the edd file.
Output:EnergyManagementSystem,
   Verbose,
   Verbose,
   Verbose;
When reviewing the edd results of the simulation, which describes in detail the results of each line of EMS code, there are several sections of output. The first information is related to EMS code results for the warmup period. This information is good for determining if the code is working as expected but results may be different than the actual simulation since the model is in warmup mode. Note the occurance is During Warmup.
Example:
****  Begin EMS Language Processor Error and Trace Output  ***
<Erl program name, line #, line text, result, occurance timing information ... >
CURVEOVERWRITEMGR,Line 1,SET TTMP = COILINLETDBT,0.0, During Warmup, Occurrence info=MIAMI INTL AP ANN HTG 99.6% CONDNS DB, 01/21 00:00 - 00:15
CURVEOVERWRITEMGR,Line 2,SET WTMP = COILINLETW,0.0, During Warmup, Occurrence info=MIAMI INTL AP ANN HTG 99.6% CONDNS DB, 01/21 00:00 - 00:15
The next section describes the available actuators. This section is turned on a off and organized via the Output:EnergyManagementSystem input for Actuator Availability Dictionary Reporting.
! <EnergyManagementSystem:Actuator Available>, Component Unique Name, Component Type,  Control Type, Units
EnergyManagementSystem:Actuator Available,Environment,Weather Data,Outdoor Dry Bulb,[C]
EnergyManagementSystem:Actuator Available,ACTIVITY SCH,Schedule:Compact,Schedule Value,[ ]
The next section is a description of the internal variables and is similarly control via the Output:EnergyManagementSystem input for Internal Variable Availability Dictionary Reporting.
! <EnergyManagementSystem:InternalVariable Available>, Unique Name, Internal Data Type, Units
EnergyManagementSystem:InternalVariable Available,HOT WATER LOOP,Plant Design Volume Flow Rate,[m3/s]
EnergyManagementSystem:InternalVariable Available,WEST ZONE,People Count Design Level,[each]
Following this section is more warmup period results and repeat depending on how many warmup period periods are required for the specific simulation to find convergence before beginning the actual simulation. This figure below shows several warmup period prior to the actual simulation.
When the warmup periods have completed the EMS results for the actual simulation will be reported. Shown below is the final warmup period report, including the occurance description of During Warmup. Note the time stamp for EMS code lines 16 through 20 show times of 23:45 - 24:00. When the program executes again, the occurance info does not include the During Warmup descriptor. This is the result of the actual simulation starting at time 00:00 - 00:15 at the first line of EMS code in order of program execution.
CURVEOVERWRITEMGR,Line 16,SET CURVEINPUT2 = CURVEINPUT,1.110623, During Warmup, Occurrence info=MIAMI INTL AP ANN HTG 99.6% CONDNS DB, 01/21 23:45 - 24:00
CURVEOVERWRITEMGR,Line 17,IF OAT > 31.0,0.0, During Warmup, Occurrence info=MIAMI INTL AP ANN HTG 99.6% CONDNS DB, 01/21 23:45 - 24:00
CURVEOVERWRITEMGR,Line 19,ENDIF,, During Warmup, Occurrence info=MIAMI INTL AP ANN HTG 99.6% CONDNS DB, 01/21 23:45 - 24:00
CURVEOVERWRITEMGR,Line 20,SET CURVEOVERWRITE = CURVEINPUT,1.110623, During Warmup, Occurrence info=MIAMI INTL AP ANN HTG 99.6% CONDNS DB, 01/21 23:45 - 24:00
CURVEOVERWRITEMGR,Line 1,SET TTMP = COILINLETDBT,21.417543, Occurrence info=MIAMI INTL AP ANN HTG 99.6% CONDNS DB, 01/21 00:00 - 00:15
CURVEOVERWRITEMGR,Line 2,SET WTMP = COILINLETW,6.847167E-003, Occurrence info=MIAMI INTL AP ANN HTG 99.6% CONDNS DB, 01/21 00:00 - 00:15
The report includes warmup days if selected and the weather file simulation as described in the SimulationControl object. To reduce the amount of output and review only the results of the weather file simulation, select No for Run Simulation for Sizing Periods.
SimulationControl,
  Yes,                     !- Do Zone Sizing Calculation
  No,                      !- Do System Sizing Calculation
  No,                      !- Do Plant Sizing Calculation
  Yes,                     !- Run Simulation for Sizing Periods
  Yes;                     !- Run Simulation for Weather File Run Periods
| | 4 | No.4 Revision |
The results will vary depending on the EnergyPlus Model Calling Point input in the EnergyManagementSystem:ProgramCallingManager object. The zone temperature is the temperature at the end of the previous current time step.step and is calculated at the end of the current time step (after your EMS program runs).
Most of the calling points will work as:
Read zone temperature from previous time step (your row 5 zone temp or 24.19473)) and make a decision. In this case the EMS decided to open the window. The result of the decision will be the zone temperature in the next time step (your row 6 zone temp or 24.483). Now 24.483 is the new zone temperature.
If you turn on EMS output reporting you can see the results of the EMS code in the edd file.
Output:EnergyManagementSystem,
   Verbose,
   Verbose,
   Verbose;
When reviewing the edd results of the simulation, which describes in detail the results of each line of EMS code, there are several sections of output. The first information is related to EMS code results for the warmup period. This information is good for determining if the code is working as expected but results may be different than the actual simulation since the model is in warmup mode. Note the occurance is During Warmup.
Example:
****  Begin EMS Language Processor Error and Trace Output  ***
<Erl program name, line #, line text, result, occurance timing information ... >
CURVEOVERWRITEMGR,Line 1,SET TTMP = COILINLETDBT,0.0, During Warmup, Occurrence info=MIAMI INTL AP ANN HTG 99.6% CONDNS DB, 01/21 00:00 - 00:15
CURVEOVERWRITEMGR,Line 2,SET WTMP = COILINLETW,0.0, During Warmup, Occurrence info=MIAMI INTL AP ANN HTG 99.6% CONDNS DB, 01/21 00:00 - 00:15
The next section describes the available actuators. This section is turned on a off and organized via the Output:EnergyManagementSystem input for Actuator Availability Dictionary Reporting.
! <EnergyManagementSystem:Actuator Available>, Component Unique Name, Component Type,  Control Type, Units
EnergyManagementSystem:Actuator Available,Environment,Weather Data,Outdoor Dry Bulb,[C]
EnergyManagementSystem:Actuator Available,ACTIVITY SCH,Schedule:Compact,Schedule Value,[ ]
The next section is a description of the internal variables and is similarly control via the Output:EnergyManagementSystem input for Internal Variable Availability Dictionary Reporting.
! <EnergyManagementSystem:InternalVariable Available>, Unique Name, Internal Data Type, Units
EnergyManagementSystem:InternalVariable Available,HOT WATER LOOP,Plant Design Volume Flow Rate,[m3/s]
EnergyManagementSystem:InternalVariable Available,WEST ZONE,People Count Design Level,[each]
Following this section is more warmup period results and repeat depending on how many warmup periods are required for the specific simulation to find convergence before beginning the actual simulation. This figure below shows several warmup period prior to the actual simulation.
When the warmup periods have completed the EMS results for the actual simulation will be reported. Shown below is the final warmup period report, including the occurance description of During Warmup. Note the time stamp for EMS code lines 16 through 20 show times of 23:45 - 24:00. When the program executes again, the occurance info does not include the During Warmup descriptor. This is the result of the actual simulation starting at time 00:00 - 00:15 at the first line of EMS code in order of program execution.
CURVEOVERWRITEMGR,Line 16,SET CURVEINPUT2 = CURVEINPUT,1.110623, During Warmup, Occurrence info=MIAMI INTL AP ANN HTG 99.6% CONDNS DB, 01/21 23:45 - 24:00
CURVEOVERWRITEMGR,Line 17,IF OAT > 31.0,0.0, During Warmup, Occurrence info=MIAMI INTL AP ANN HTG 99.6% CONDNS DB, 01/21 23:45 - 24:00
CURVEOVERWRITEMGR,Line 19,ENDIF,, During Warmup, Occurrence info=MIAMI INTL AP ANN HTG 99.6% CONDNS DB, 01/21 23:45 - 24:00
CURVEOVERWRITEMGR,Line 20,SET CURVEOVERWRITE = CURVEINPUT,1.110623, During Warmup, Occurrence info=MIAMI INTL AP ANN HTG 99.6% CONDNS DB, 01/21 23:45 - 24:00
CURVEOVERWRITEMGR,Line 1,SET TTMP = COILINLETDBT,21.417543, Occurrence info=MIAMI INTL AP ANN HTG 99.6% CONDNS DB, 01/21 00:00 - 00:15
CURVEOVERWRITEMGR,Line 2,SET WTMP = COILINLETW,6.847167E-003, Occurrence info=MIAMI INTL AP ANN HTG 99.6% CONDNS DB, 01/21 00:00 - 00:15
The report includes warmup days if selected and the weather file simulation as described in the SimulationControl object. To reduce the amount of output and review only the results of the weather file simulation, select No for Run Simulation for Sizing Periods.
SimulationControl,
  Yes,                     !- Do Zone Sizing Calculation
  No,                      !- Do System Sizing Calculation
  No,                      !- Do Plant Sizing Calculation
  Yes,                     !- Run Simulation for Sizing Periods
  Yes;                     !- Run Simulation for Weather File Run Periods
| | 5 | No.5 Revision |
The results will vary depending on the EnergyPlus Model Calling Point input in the EnergyManagementSystem:ProgramCallingManager object. The zone temperature is the temperature at the end of the current time step and is calculated at the end of the current time step (after your EMS program runs).
Most of the calling points will work as:
Read zone temperature from previous time step (your row 5 zone temp or 24.19473)) and make a decision. In this case the EMS decided to open the window. The result of the decision will be the zone temperature in the next end of this time step (your row 6 zone temp or 24.483). Now 24.483 is the new zone temperature.
If you turn on EMS output reporting you can see the results of the EMS code in the edd file.
Output:EnergyManagementSystem,
   Verbose,
   Verbose,
   Verbose;
When reviewing the edd results of the simulation, which describes in detail the results of each line of EMS code, there are several sections of output. The first information is related to EMS code results for the warmup period. This information is good for determining if the code is working as expected but results may be different than the actual simulation since the model is in warmup mode. Note the occurance is During Warmup.
Example:
****  Begin EMS Language Processor Error and Trace Output  ***
<Erl program name, line #, line text, result, occurance timing information ... >
CURVEOVERWRITEMGR,Line 1,SET TTMP = COILINLETDBT,0.0, During Warmup, Occurrence info=MIAMI INTL AP ANN HTG 99.6% CONDNS DB, 01/21 00:00 - 00:15
CURVEOVERWRITEMGR,Line 2,SET WTMP = COILINLETW,0.0, During Warmup, Occurrence info=MIAMI INTL AP ANN HTG 99.6% CONDNS DB, 01/21 00:00 - 00:15
The next section describes the available actuators. This section is turned on a off and organized via the Output:EnergyManagementSystem input for Actuator Availability Dictionary Reporting.
! <EnergyManagementSystem:Actuator Available>, Component Unique Name, Component Type,  Control Type, Units
EnergyManagementSystem:Actuator Available,Environment,Weather Data,Outdoor Dry Bulb,[C]
EnergyManagementSystem:Actuator Available,ACTIVITY SCH,Schedule:Compact,Schedule Value,[ ]
The next section is a description of the internal variables and is similarly control via the Output:EnergyManagementSystem input for Internal Variable Availability Dictionary Reporting.
! <EnergyManagementSystem:InternalVariable Available>, Unique Name, Internal Data Type, Units
EnergyManagementSystem:InternalVariable Available,HOT WATER LOOP,Plant Design Volume Flow Rate,[m3/s]
EnergyManagementSystem:InternalVariable Available,WEST ZONE,People Count Design Level,[each]
Following this section is more warmup period results and repeat depending on how many warmup periods are required for the specific simulation to find convergence before beginning the actual simulation. This figure below shows several warmup period prior to the actual simulation.
When the warmup periods have completed the EMS results for the actual simulation will be reported. Shown below is the final warmup period report, including the occurance description of During Warmup. Note the time stamp for EMS code lines 16 through 20 show times of 23:45 - 24:00. When the program executes again, the occurance info does not include the During Warmup descriptor. This is the result of the actual simulation starting at time 00:00 - 00:15 at the first line of EMS code in order of program execution.
CURVEOVERWRITEMGR,Line 16,SET CURVEINPUT2 = CURVEINPUT,1.110623, During Warmup, Occurrence info=MIAMI INTL AP ANN HTG 99.6% CONDNS DB, 01/21 23:45 - 24:00
CURVEOVERWRITEMGR,Line 17,IF OAT > 31.0,0.0, During Warmup, Occurrence info=MIAMI INTL AP ANN HTG 99.6% CONDNS DB, 01/21 23:45 - 24:00
CURVEOVERWRITEMGR,Line 19,ENDIF,, During Warmup, Occurrence info=MIAMI INTL AP ANN HTG 99.6% CONDNS DB, 01/21 23:45 - 24:00
CURVEOVERWRITEMGR,Line 20,SET CURVEOVERWRITE = CURVEINPUT,1.110623, During Warmup, Occurrence info=MIAMI INTL AP ANN HTG 99.6% CONDNS DB, 01/21 23:45 - 24:00
CURVEOVERWRITEMGR,Line 1,SET TTMP = COILINLETDBT,21.417543, Occurrence info=MIAMI INTL AP ANN HTG 99.6% CONDNS DB, 01/21 00:00 - 00:15
CURVEOVERWRITEMGR,Line 2,SET WTMP = COILINLETW,6.847167E-003, Occurrence info=MIAMI INTL AP ANN HTG 99.6% CONDNS DB, 01/21 00:00 - 00:15
The report includes warmup days if selected and the weather file simulation as described in the SimulationControl object. To reduce the amount of output and review only the results of the weather file simulation, select No for Run Simulation for Sizing Periods.
SimulationControl,
  Yes,                     !- Do Zone Sizing Calculation
  No,                      !- Do System Sizing Calculation
  No,                      !- Do Plant Sizing Calculation
  Yes,                     !- Run Simulation for Sizing Periods
  Yes;                     !- Run Simulation for Weather File Run Periods


