First time here? Check out the Help page!
answered 2017-11-25 12:51:24 -0500
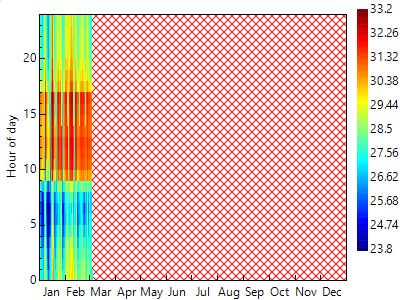
Here's a plot of a heat map showing results from June-July as if they belong to January-February.
OA