Question-and-Answer Resource for the Building Energy Modeling Community
First time here? Check out the Help page!
| | 1 | initial version |
@TomB is right, and the chart he suggested should be your starting point:
It will probably look something like this:
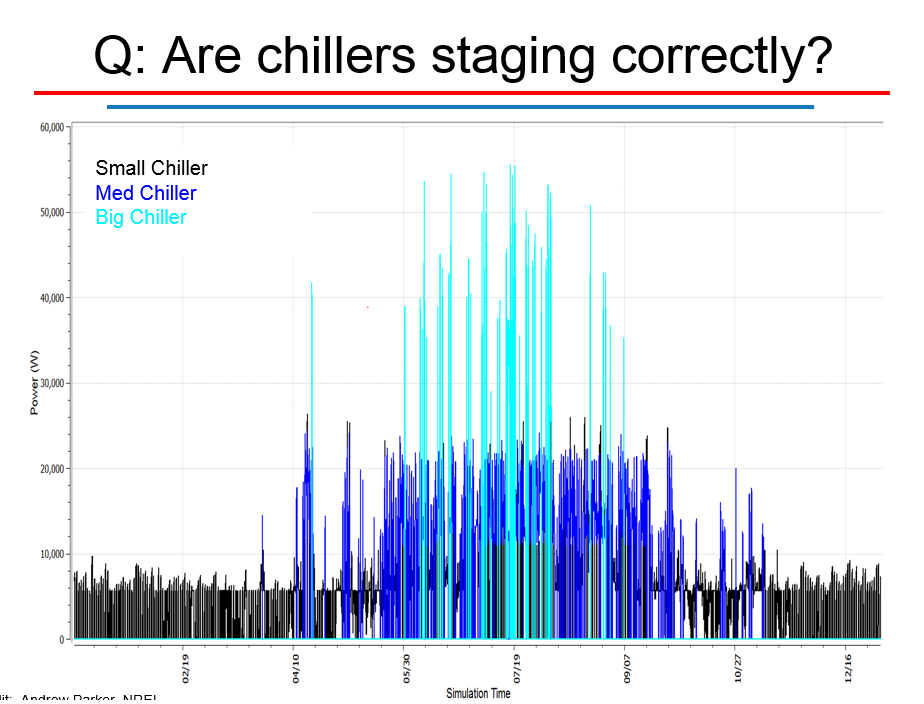
Graphed this way, I find it challenging to see if the overall staging scheme is working correctly without a lot of zooming in on the details of each day unless the staging scheme is very simple. Instead, I like to use those same outputs to create a different graph to understand how the chillers (or boilers, or other plant equipment) are staging:
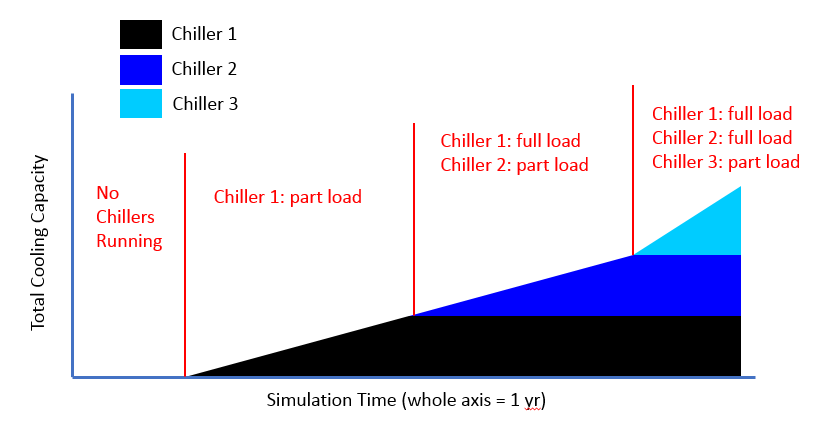
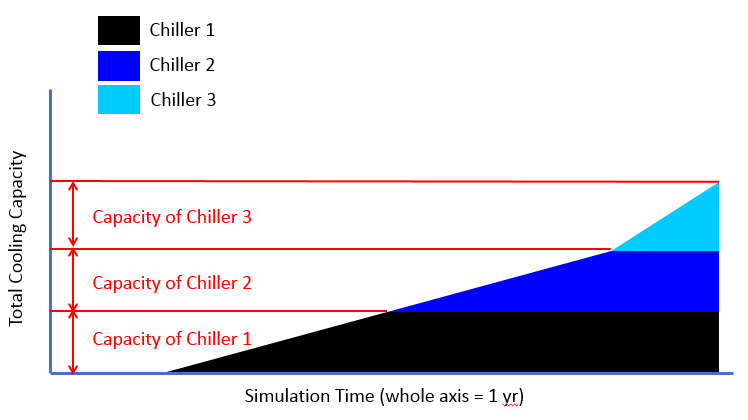
Three chillers running sequentially should look like the image below.
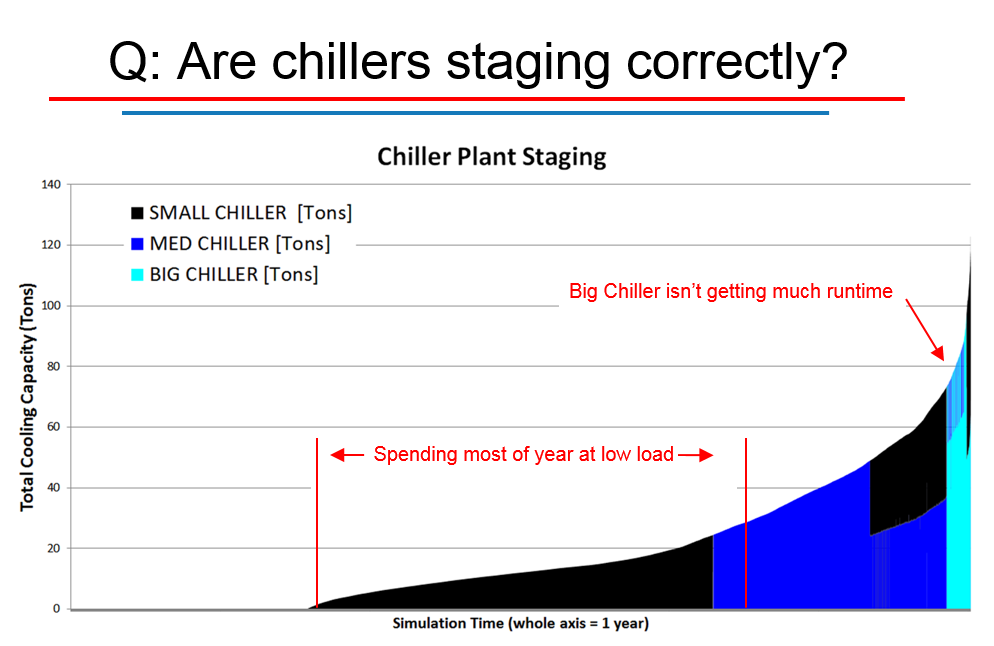
The graph below shows actual simulation output for a more complex staging scheme. There are 3 chillers and 4 different capacity ranges. Only certain chillers are used inside each capacity range, and within each range, the chillers stage 'optimally'. As you can see, this chart makes it very easy to confirm that the model is working as intended.
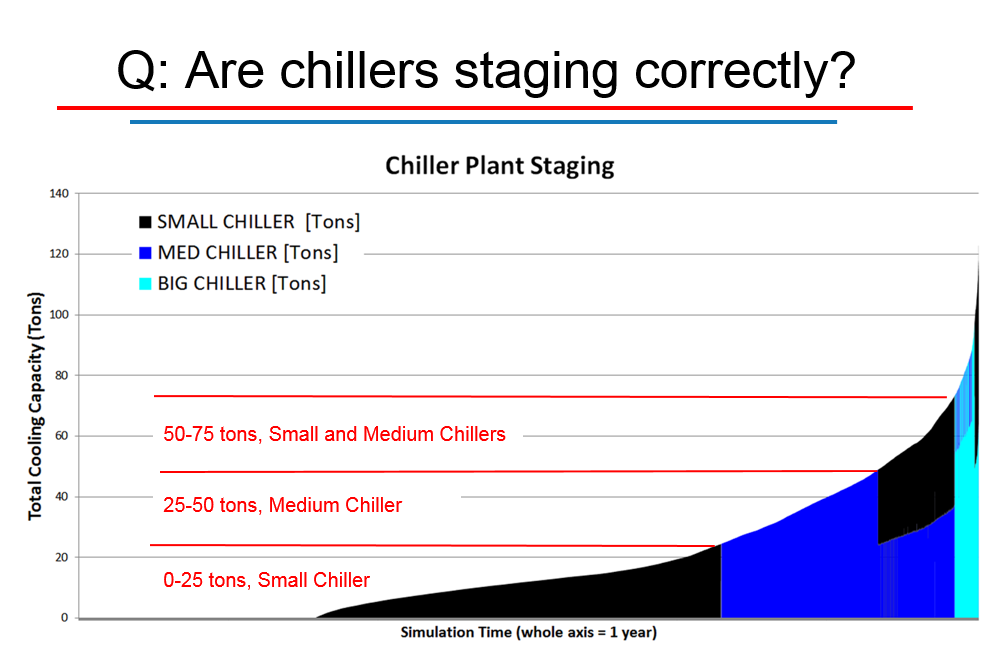
A nice bonus of this graph is that you can easily see how much of the year is spent in each operating range.
| | 2 | No.2 Revision |
@TomB is right, and the chart he suggested should be your starting point:
It will probably look something like this:
Graphed this way, I find it challenging to see if the overall staging scheme is working correctly without a lot of zooming in on the details of each day unless the staging scheme is very simple. Instead, I like to use those same outputs to create a different graph to understand how the chillers (or boilers, or other plant equipment) are staging:
Three chillers running sequentially should look like the image below.
The graph below shows actual simulation output for a more complex staging scheme. There are 3 chillers and 4 different capacity ranges. Only certain chillers are used inside each capacity range, and within each range, the chillers stage 'optimally'. As you can see, this chart makes it very easy to confirm that the model is working as intended.
A nice bonus of this graph is that you can easily see how much of the year is spent in each operating range.
UPDATE:
First, a clarification: images 2 and 3 are just drawings in powerpoint, not actual simulation data. Images 1, 4, and 5 are actual simulation data.
Second, here are the key objects/inputs for getting staging right:
Chiller:Electric:EIR Sizing Factor. The sizing factor field controls the sizing of each piece of equipment on the plant loop, and the default is 1 (100%). If you have 3 chillers, all with a sizing factor of 1, then each chiller will be sized to meet 100% of the load of the plant loop. This means you'll end up with 300% of the required capacity, and only 1 chiller will ever run. If you want to get 3 equally sized chillers, which, combined, would meet the total cooling load, you would set the sizing factor to 0.33 in each chiller. Also, the sizes don't have to be equal, you could have a 0.2, a 0.3, and a 0.5 or some other combination.
PlantEquipmentOperation:CoolingLoad. This object determines which pieces of equipment are allowed to operate for a given range of capacities. By default, there is only 1 range (0+ W), and every piece of equipment is allowed to operate. The 4th image in this post shows the results of a more detailed staging scheme:
It is important to understand that allowed to operate just means that the equipment may be used, not that it will be used. Determining which pieces of equipment do operate is the role of the next field:
PlantLoop Load Distribution Scheme. This field determines how the load will be split between the pieces of equipment listed for this load range. This determines which pieces of equipment do operate. When there is a single piece of equipment listed in a range, it is pretty simple. When there are multiple pieces of equipment listed, the various options for this field will distribute load in more complex ways (read the documentation). Note that the order of the equipment inside each range in the PlantEquipmentOperation:CoolingLoad matters for some of these cases. For example, SequentialLoad loads equipment in the order it is listed.


