Question-and-Answer Resource for the Building Energy Modeling Community
| | 1 | initial version |
I would explain this using the pump affinity laws. Power is proportional to the cubed of shaft speed. So when the loads are low, compressor speed is reduced and compressor power reduces as the cubed of compressor speed. The top figure shows the report variables for COP, similar to your description. The bottom figure shows VRF system cooling capacity and power. At low loads (capacity) the power is lowered more than capacity. For example, take the first peak where capacity is around 40,000 W and power is around 10,000 W. Then compare to the next peak where capacity is reduced to around 15,000 W yet power dropped to about 3,000 W. The ratio of capacity to power of the first peak is 4, for the second it is 5. So at low loads, COP increases.
| | 2 | No.2 Revision |
I would explain this using the pump affinity laws. Power is proportional to the cubed of shaft speed. So when the loads are low, compressor speed is reduced and compressor power reduces as the cubed of compressor speed. The top figure shows the report variables for COP, similar to your description. The bottom figure shows VRF system cooling capacity and power. At low loads (capacity) the power is lowered more than capacity. For example, take the first peak where capacity is around 40,000 W and power is around 10,000 W. Then compare to the next peak where capacity is reduced to around 15,000 W yet power dropped to about 3,000 W. The ratio of capacity to power of the first peak is 4, for the second it is 5. So at low loads, COP increases.
| | 3 | No.3 Revision |
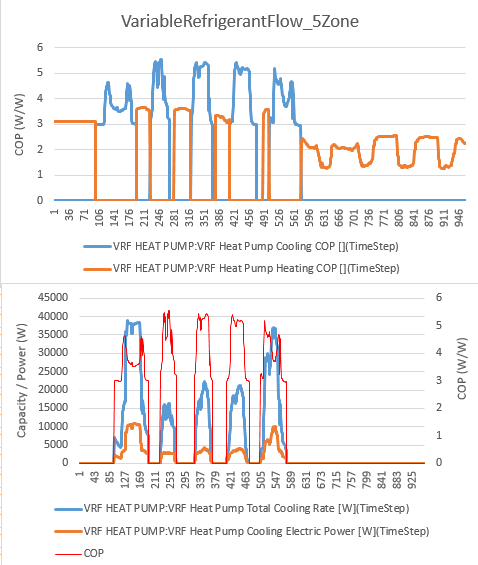
I would explain this using the pump affinity laws. Power is proportional to the cubed of shaft speed. So when the loads are low, compressor speed is reduced and compressor power reduces as the cubed of compressor speed. The top figure shows the report variables for COP, similar to your description. The bottom figure shows VRF system cooling capacity and power. power with calculated COP similar to the top figure. At low loads (capacity) the power is lowered more than capacity. For example, take the first peak where capacity is around 40,000 W and power is around 10,000 W. Then compare to the next peak where capacity is reduced to around 15,000 W yet power dropped to about 3,000 W. The ratio of capacity to power of the first peak is 4, for the second it is 5. So at low loads, COP increases.


