Question-and-Answer Resource for the Building Energy Modeling Community
| | 1 | initial version |
Because your desired reporting frequencies for both are sub-hourly (one minute for zone air temperature and 15 minutes for power consumption), you will need to run two simulations: one with a timestep of one minute (Timestep field is set to 60), and one with a timestep of 15 minutes (Timestep field is set to 4). After each simulation, be sure to open this folder on your computer:
C:\Users\user_name\AppData\Local\DesignBuilder\EnergyPlus
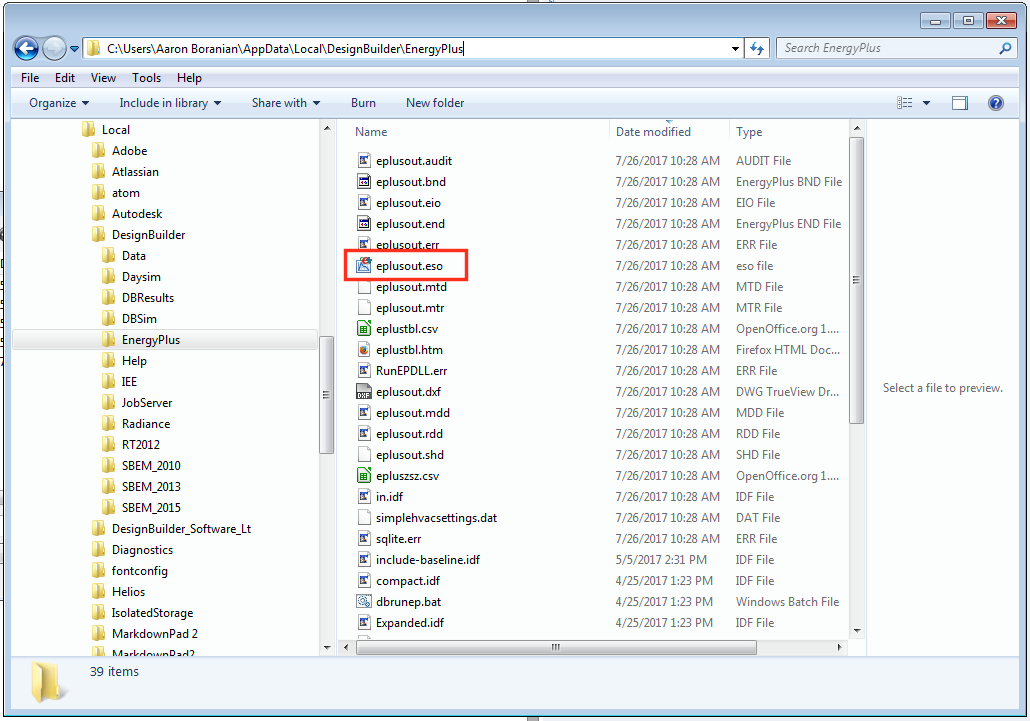
In this folder, you will see the related output files generated by EnergyPlus from the most recent simulation. The output file that you want to preserve is the ESO file (ends with .eso file extension). Change the name of this ESO file, then run a new simulation with a new timestep to generate a new ESO file. You can then use DesignBuilder's Results Viewer tool to load both ESO files in the same window to generate plots.
You can refer to this question that is also related to the DesignBuilder Results Viewer tool and running simulations with different timestep settings.


