Question-and-Answer Resource for the Building Energy Modeling Community
First time here? Check out the Help page!
| | 1 | initial version |
DesignBuilder can generate graphs of zone air temperature, you don't have to manually generate graphs from columns of output data. When you define simulation settings in the Output tab, be sure that the box for Environment is checked under "Comfort and Environmental". Also, be sure that "1-All periods" is selected for Reporting Period.
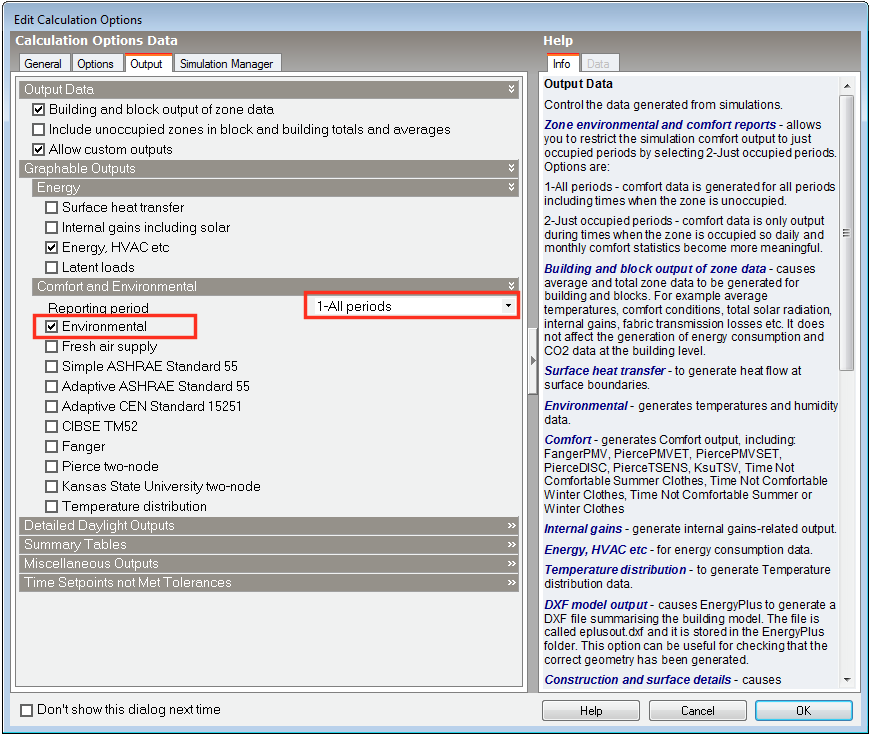
Selecting output variables to plot
Next, to plot zone air temperature at intervals shorter than one hour, you will need to set the overall simulation timestep accordingly. You can do this in simulation settings in the Options tab.
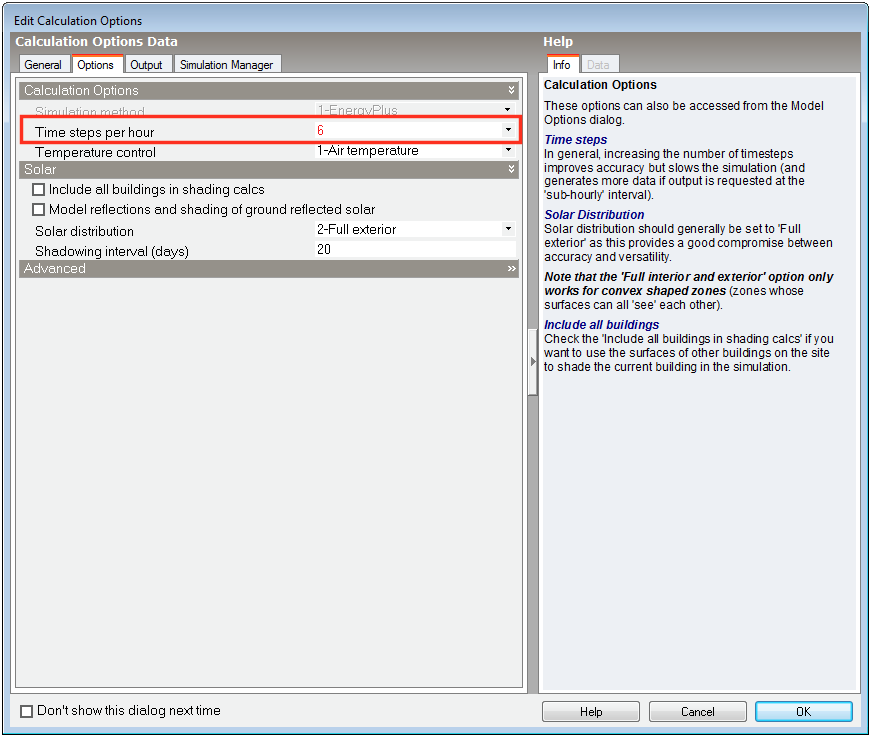
Setting simulation timestep
Finally, DesignBuilder can generate plots for different interval frequencies: monthly and annual, daily, hourly, or sub-hourly (timestep). You can select what interval frequencies you desire in simulation settings in the General tab. If you want to plot zone air temperature at every timestep, you must have at least "Sub-Hourly" checked.
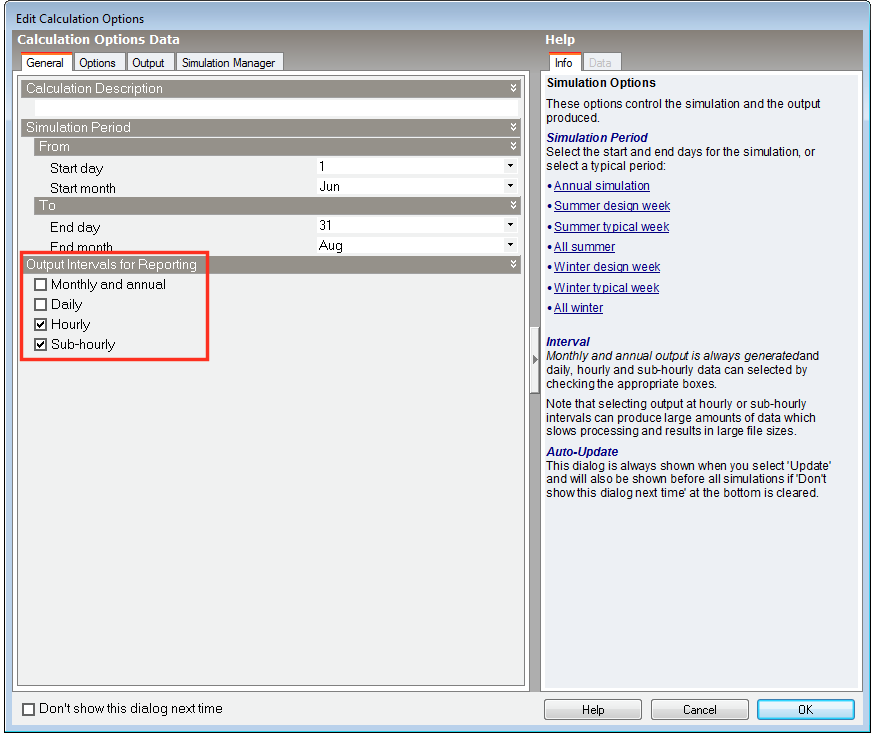
Setting output reporting interval(s)
After running a simulation, you should then be able to examine the plots DesignBuilder generates. Be sure to select the appropriate Data and Interval options.
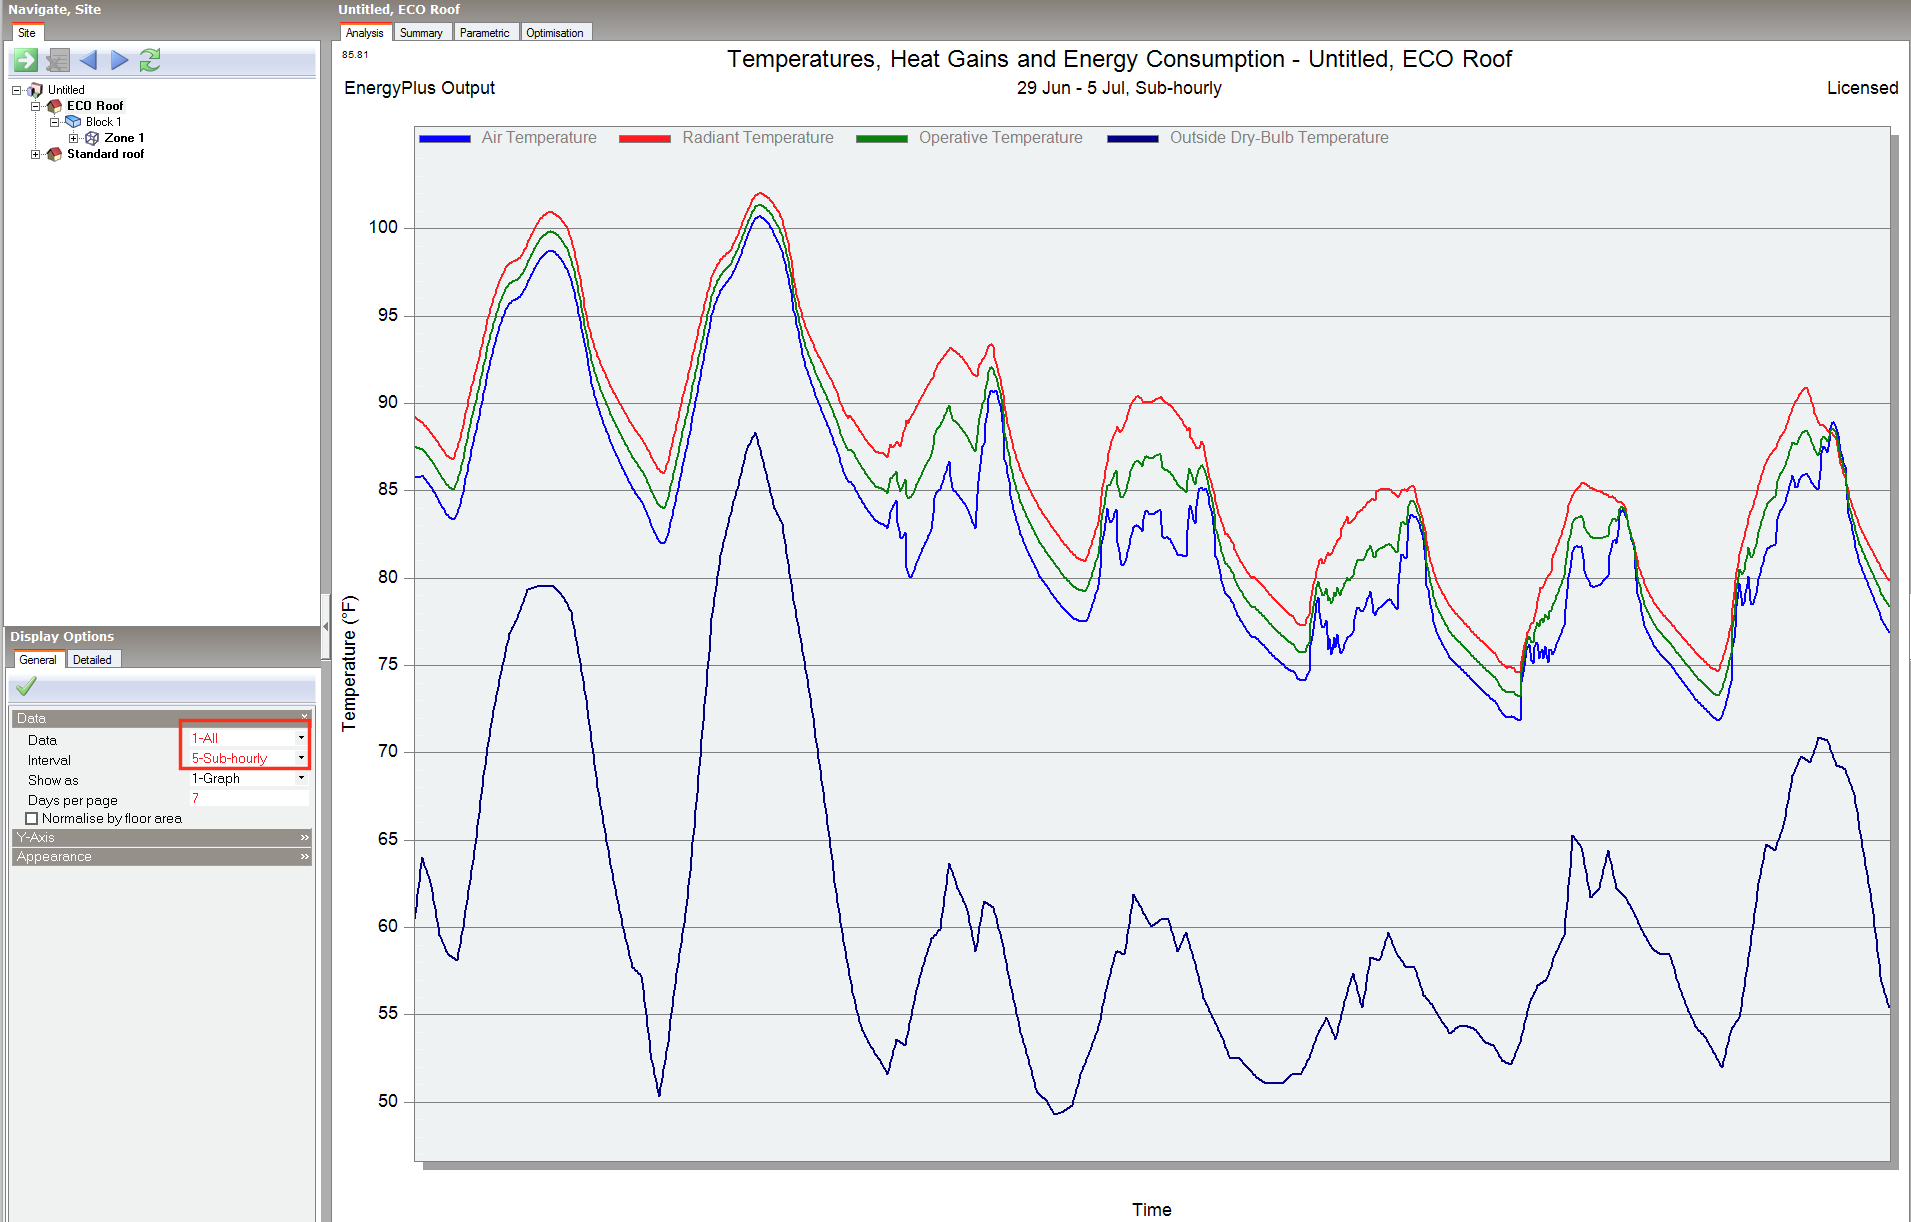
DesignBuilder plot of temperatures over one week
If you still want to create your own plots, you can do so by clicking on the View EnergyPlus results button , which will open DesignBuilder's free ESO file viewer called Results Viewer. Select the most recent .eso file, and you can then generate plots of any combination of output variable. I've shown an example below of just the zone air temperature.
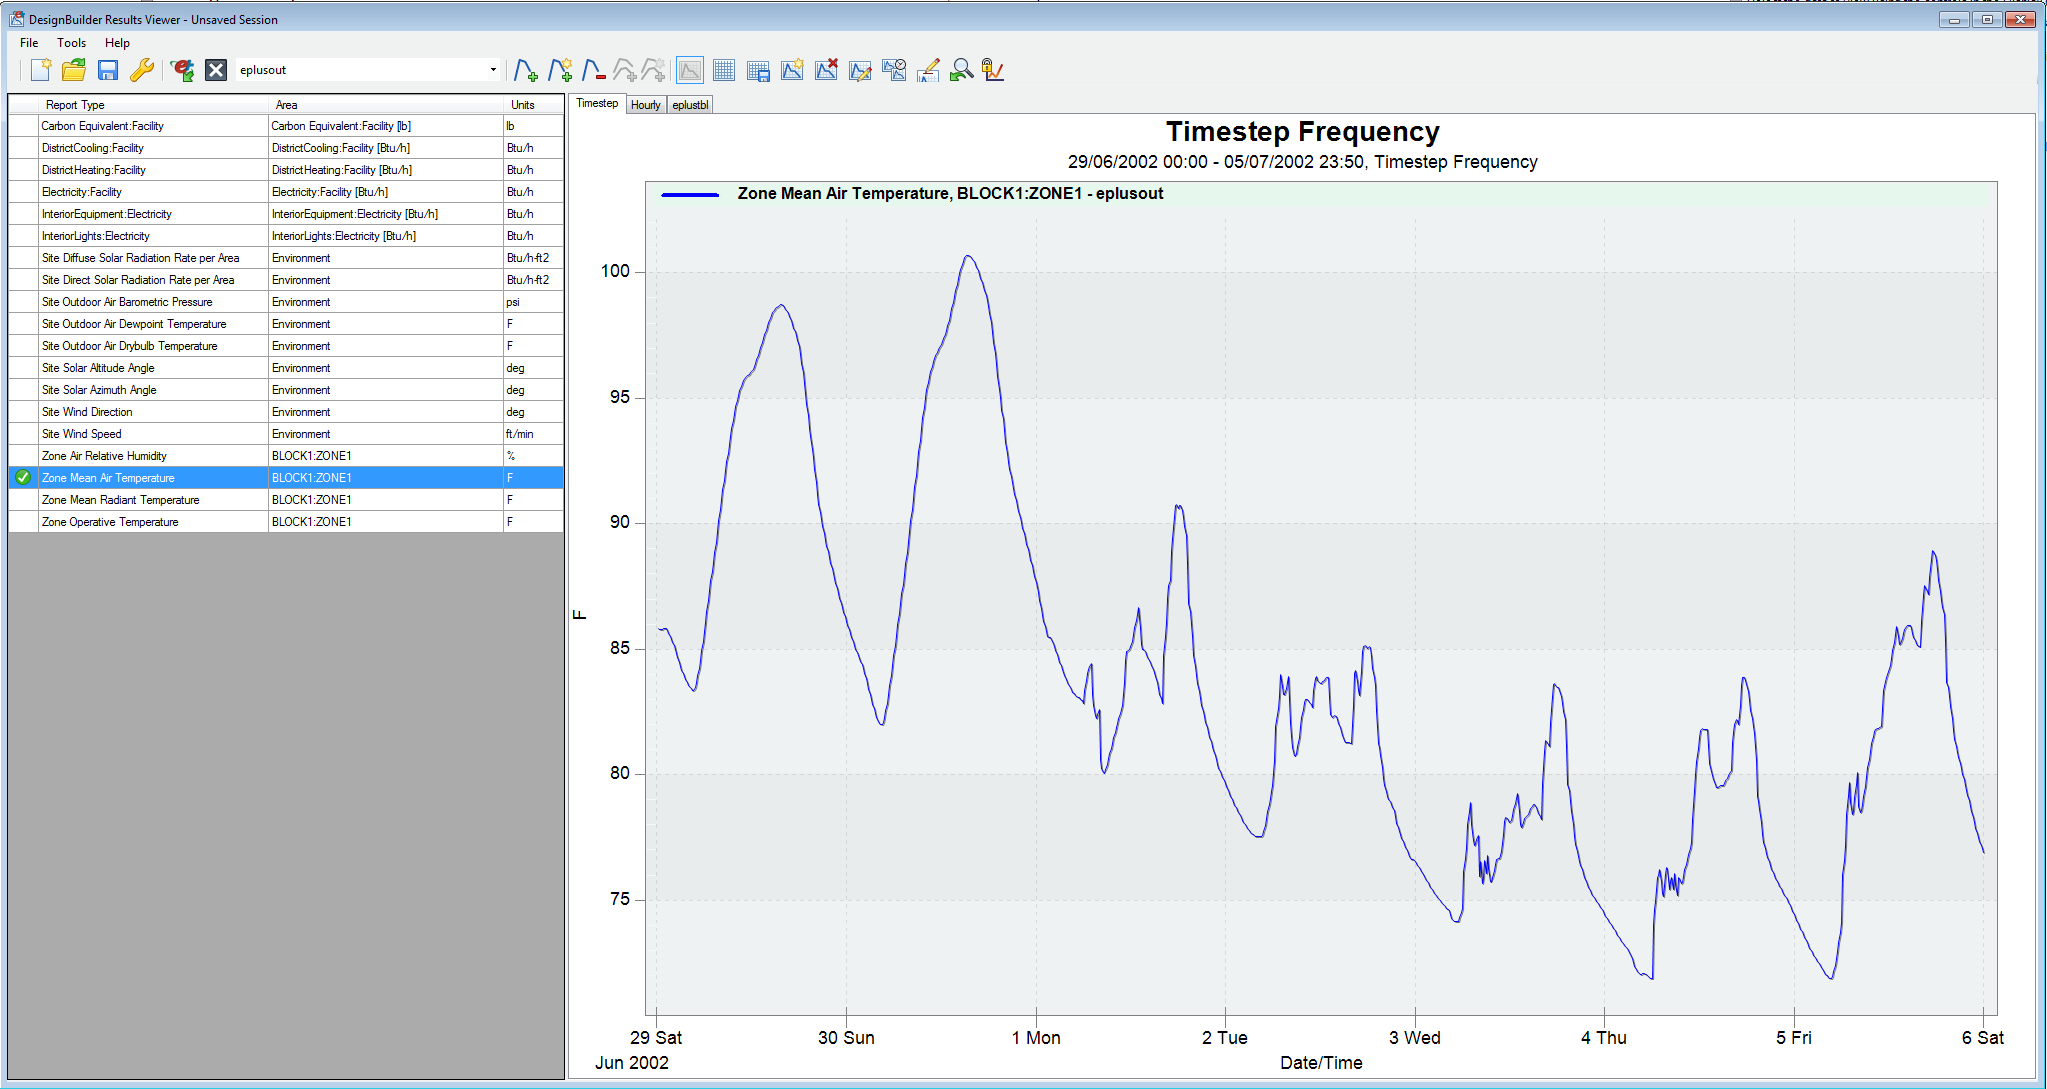
Results Viewer plot of only zone air temperature


