Question-and-Answer Resource for the Building Energy Modeling Community
First time here? Check out the Help page!
| | 1 | initial version |
Eppy can create a diagram of the plant loops using the eppy/useful_scripts/loopdiagram.py script. Running it on the 5ZoneSwimmingPool.idf example file produces this diagram. I've used this quite a bit in debugging plant layout issues before so it may be useful to you.
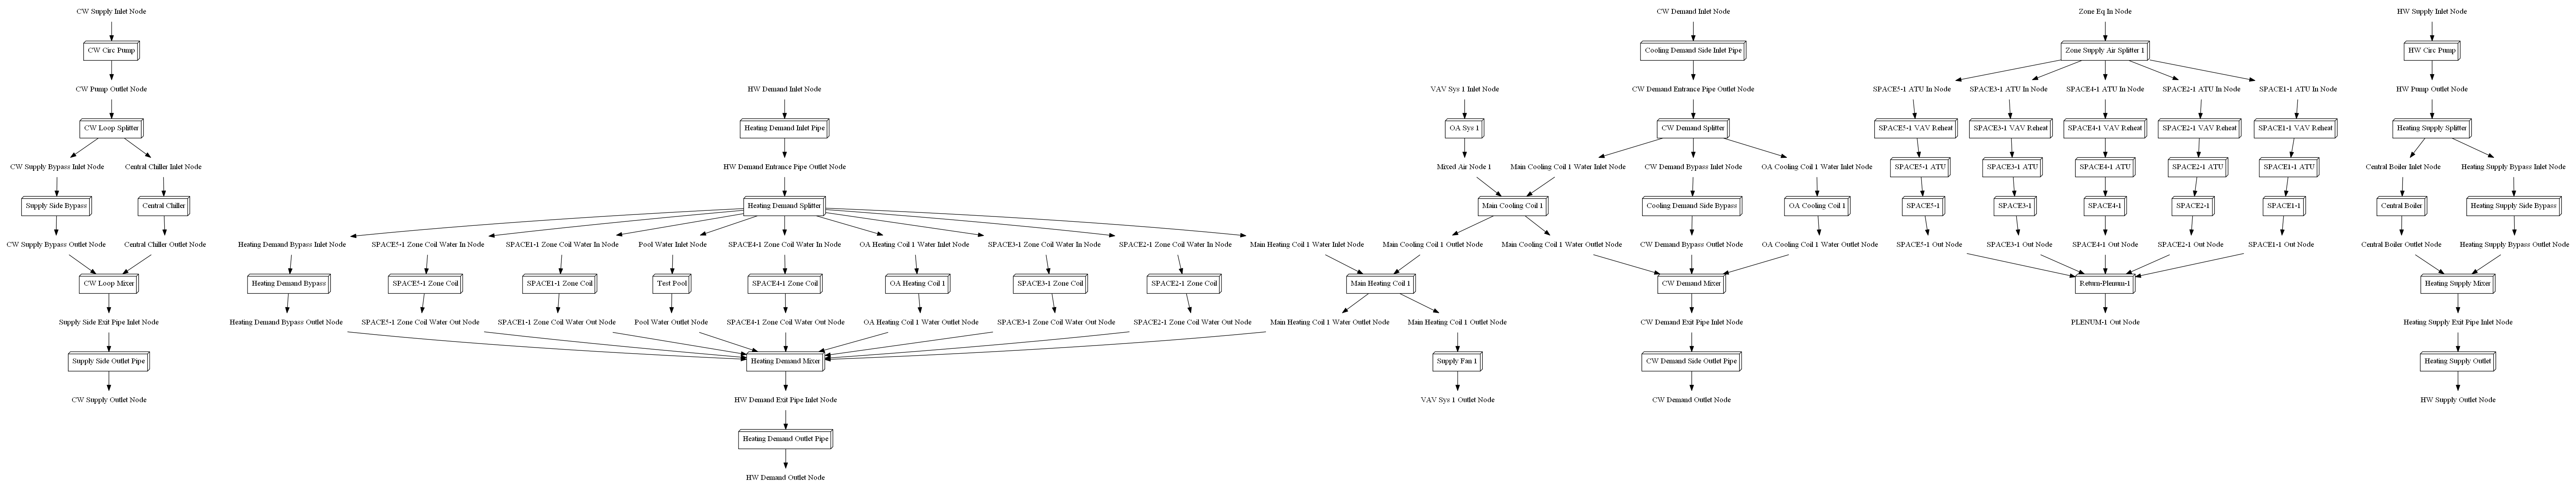
It looks like the pool Test Pool is just connected to the HW Demand loop on its own branch in parallel with the other heating zones.


