Question-and-Answer Resource for the Building Energy Modeling Community
| | 1 | initial version |
OK, I am progressing :-)
Looking at the MTD file, I found that "EnergyTransfer:Facility" is based on "Zone Air System Sensible Heating Rate", while "DistrictHeating: Facility" is based on "Zone Ideal Loads Supply Air Total Heating Rate".
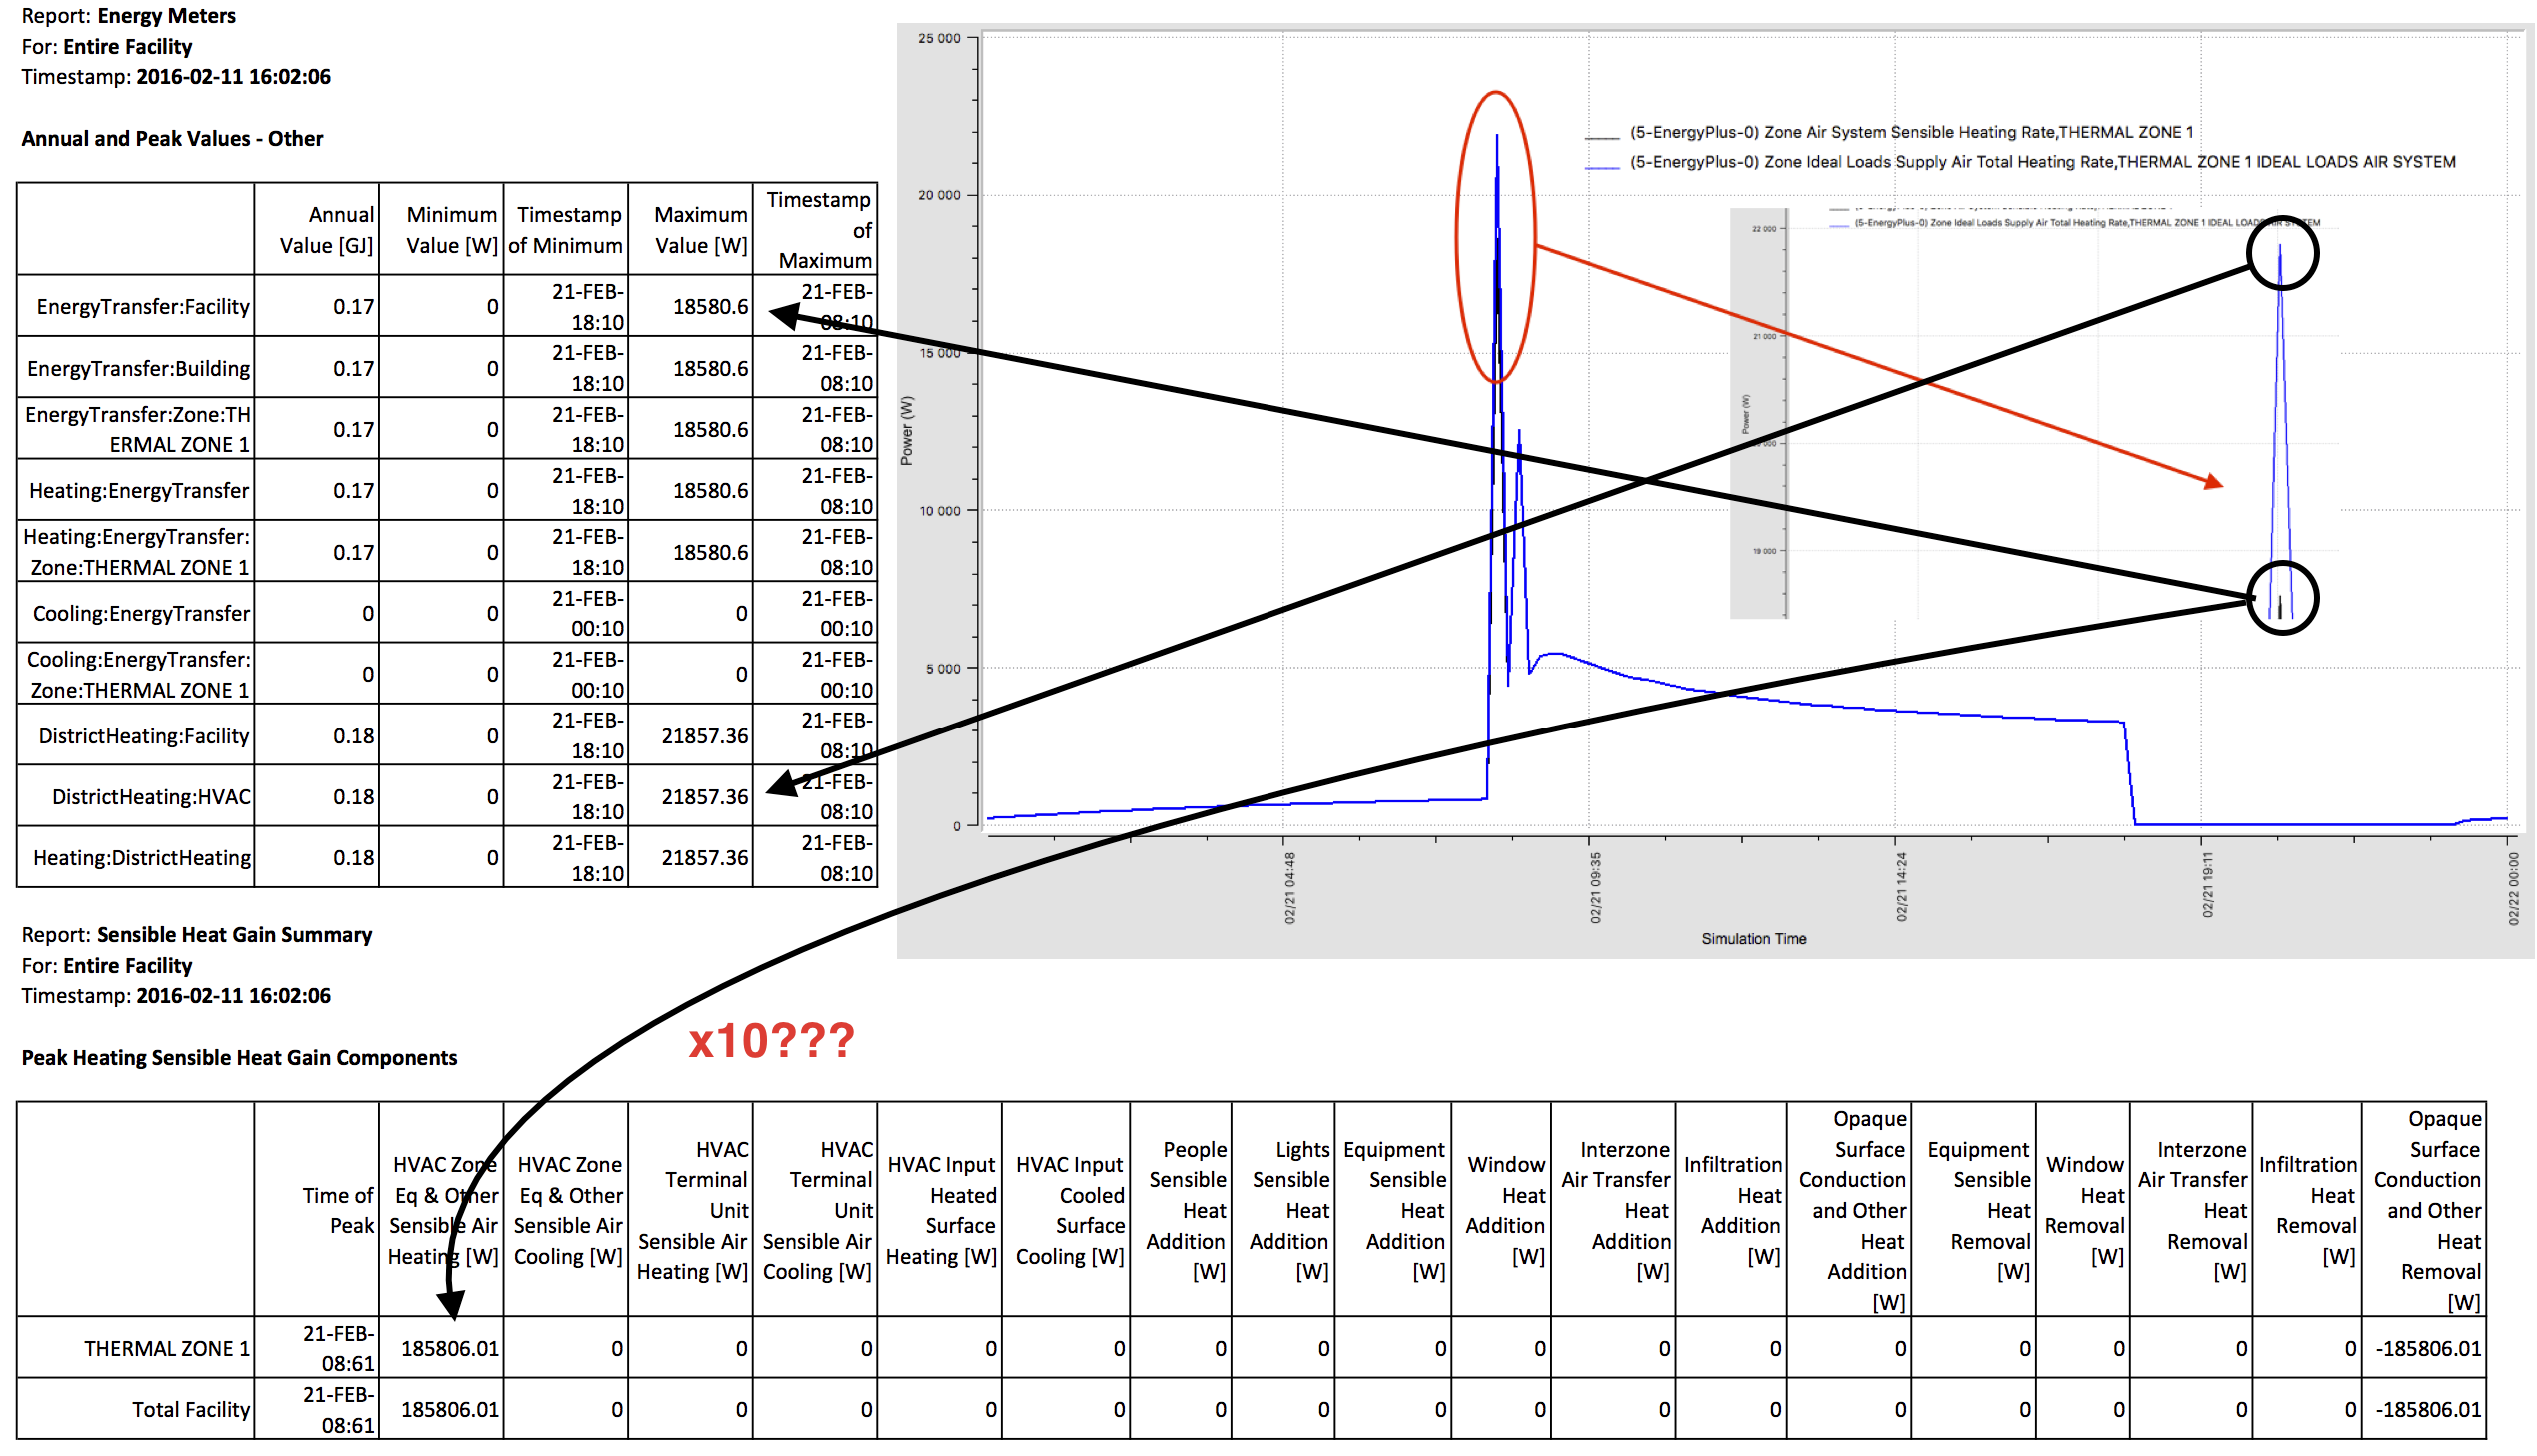
By zooming in on the chart, we see that only the peak is different. The rest of the curve is exactly the same! If I use a constant temperature setpoint, the curves are perfectly superimposed
I still can not understand the x10 factor on "Peak Sensible Heat Gain". The model contains a single area, without multiplication factor. All coefficients worth 1.0
This x10 factor also vanishes if I use a constant temperature setpoint...

