Question-and-Answer Resource for the Building Energy Modeling Community
First time here? Check out the Help page!
| | 1 | initial version |
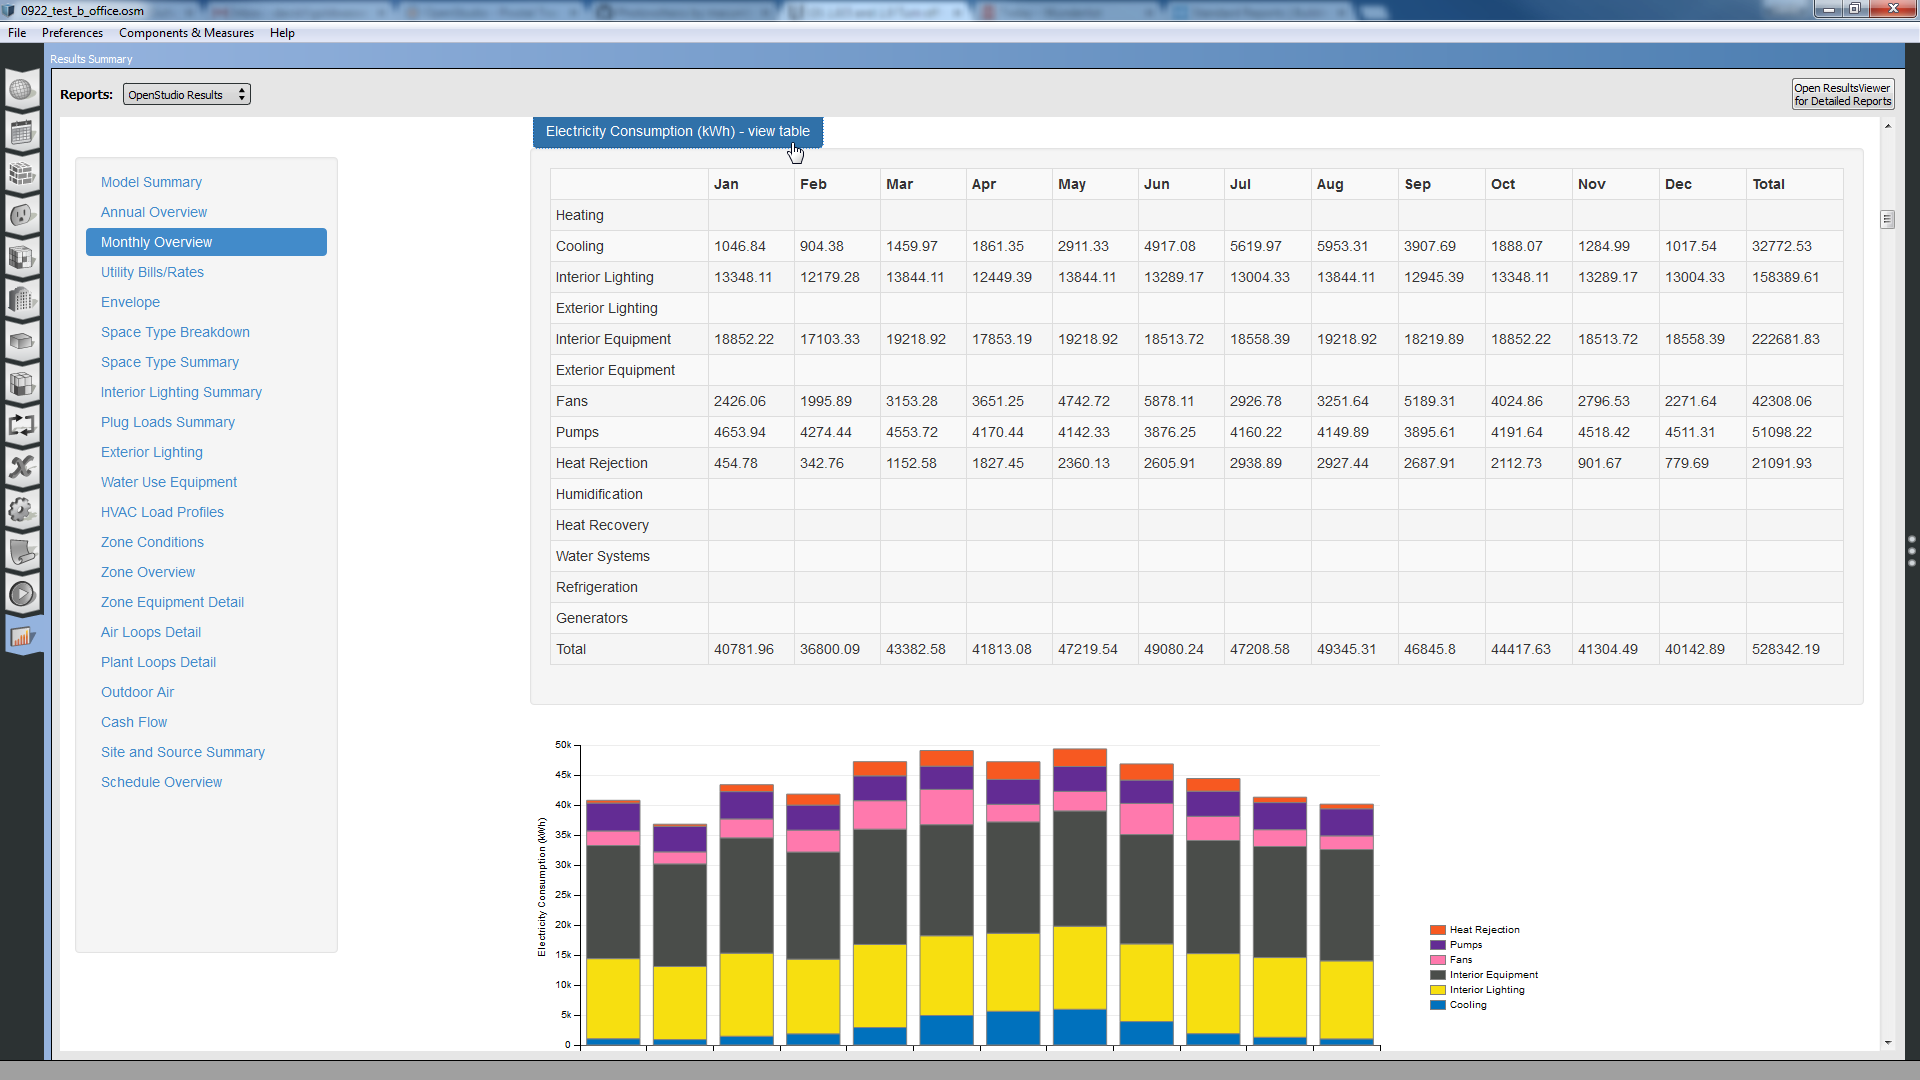
The "Monthly Overview" section of the new report shows the same data as the old standard report shows. Where we have a chart shown by default the table view is collapsed, but you can click the header where it says "view table" to see the tabular data. Below is a screenshot from old and new report. FYI - the new report is fuel type aware and will only generate charts for fuels that are used, this includes district heating and cooling.
| | 2 | No.2 Revision |
The "Monthly Overview" section of the new report shows the same data as the old standard report shows. Where we have a chart shown by default the table view is collapsed, but you can click the header where it says "view table" to see the tabular data. Below is a screenshot from old and new report. FYI - the new report is fuel type aware and will only generate charts for fuels that are used, this includes district heating and cooling.
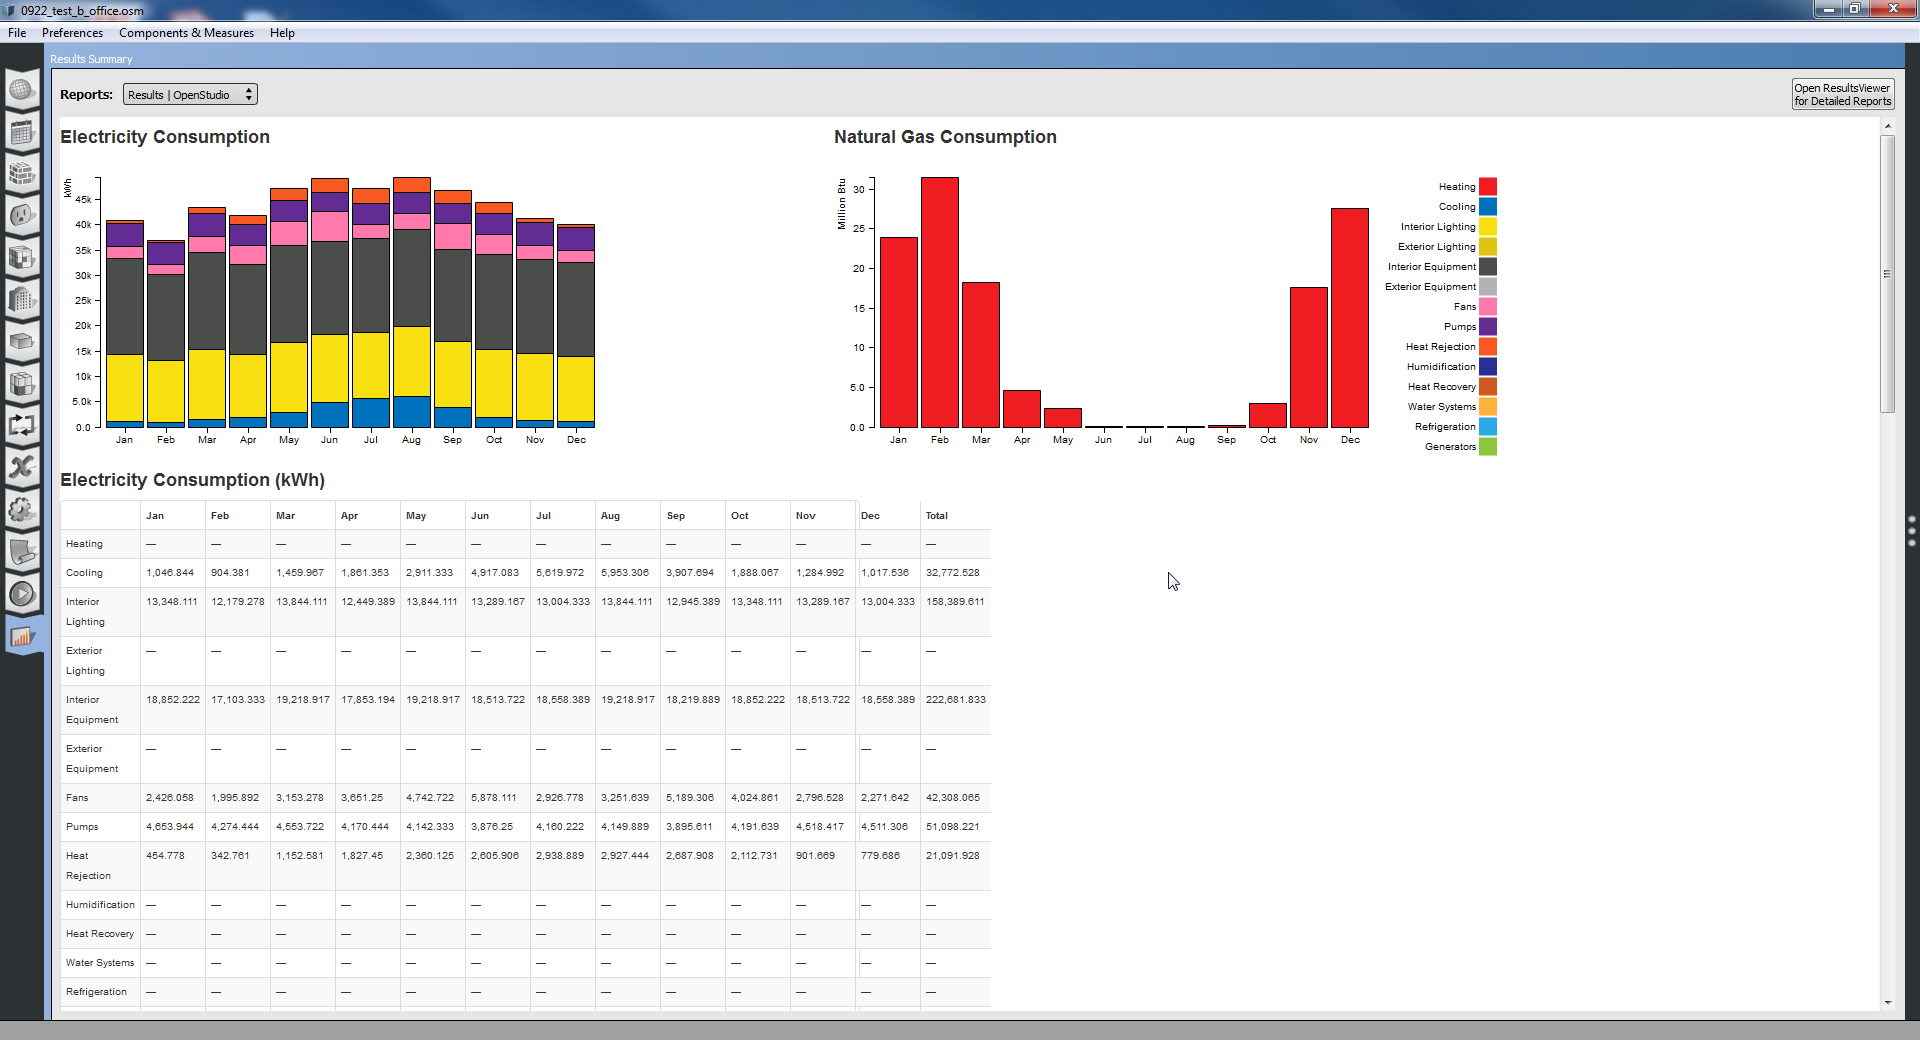
old report
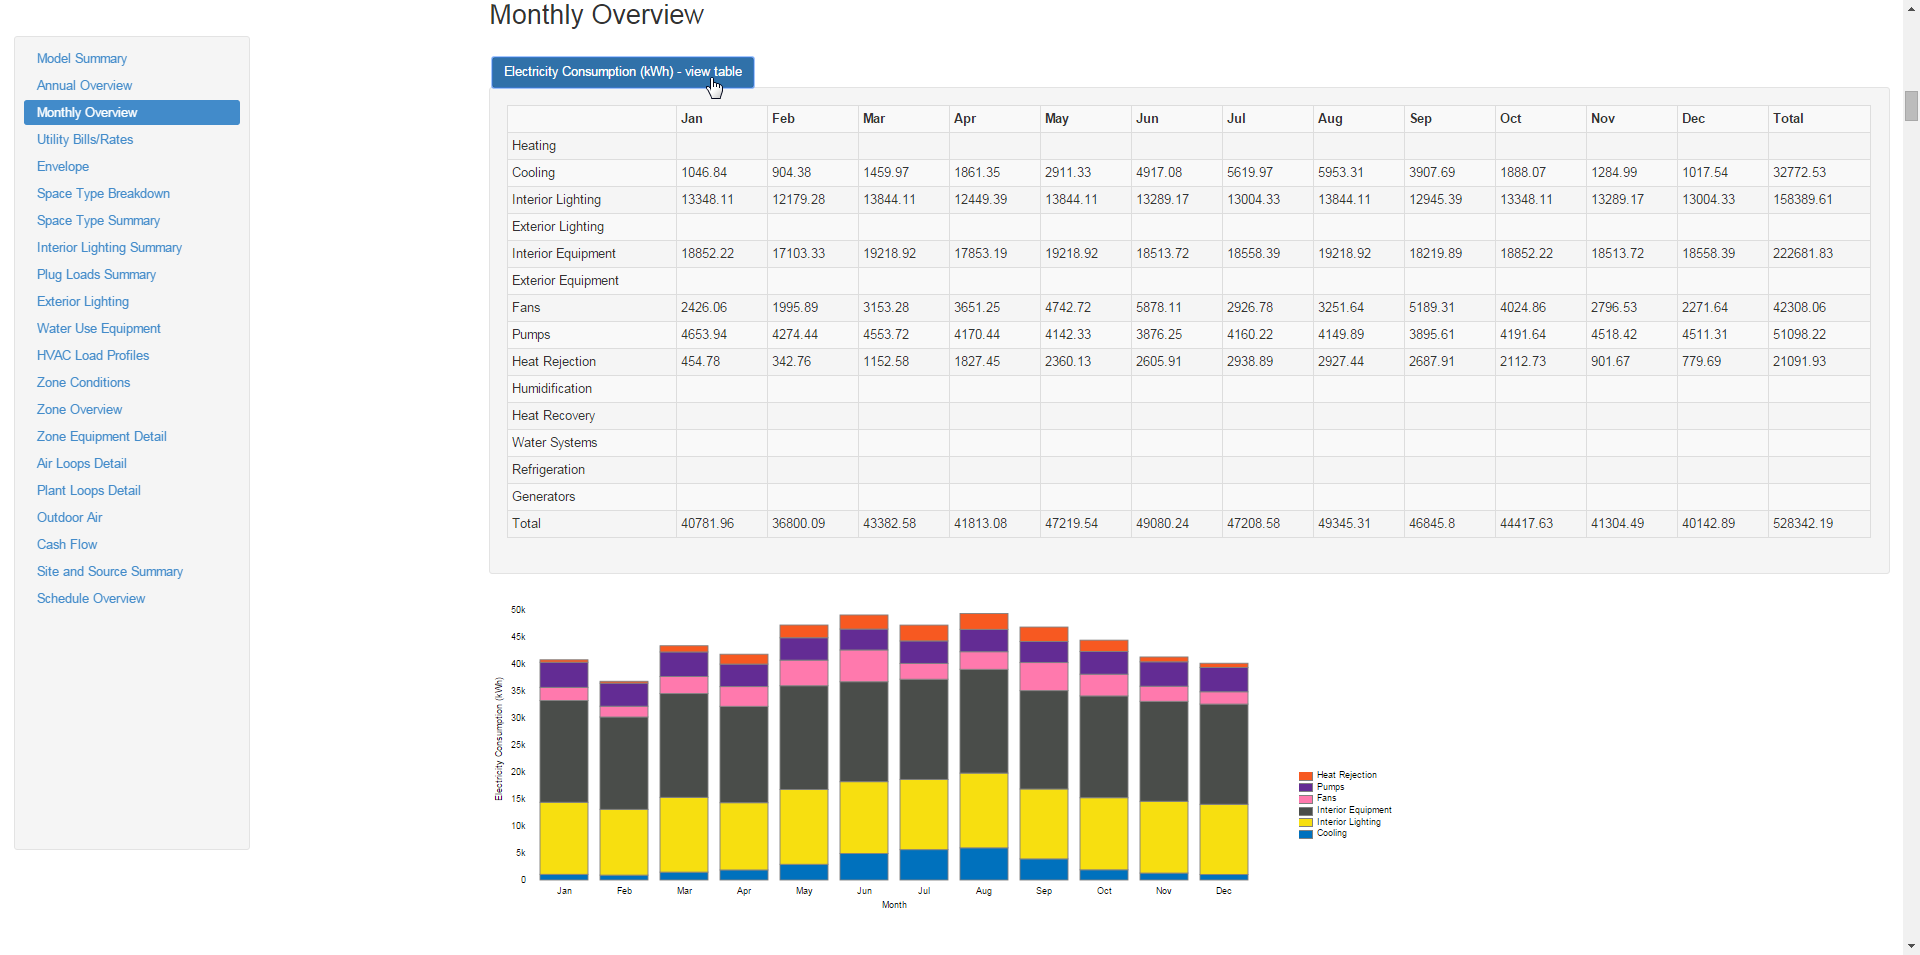
new report
@macumber, the old report is on BCL as Standard Report but for some reason doesn't show in the GUI in 1.9.0 as an option to pull in. I'll need to investigate if there is a change needed in the XML.
| | 3 | No.3 Revision |
The "Monthly Overview" section of the new report shows the same data as the old standard report shows. Where we have a chart shown by default the table view is collapsed, but you can click the header where it says "view table" to see the tabular data. Below is a screenshot from old and new report. FYI - the new report is fuel type aware and will only generate charts for fuels that are used, this includes district heating and cooling.
old report
new report
@macumber, the old report is on BCL as Standard Report but for some reason doesn't show in the GUI in 1.9.0 as an option to pull in. I'll need to investigate if there is a change needed in the XML.


