Question-and-Answer Resource for the Building Energy Modeling Community
| | 1 | initial version |
The coefficients make no sense.
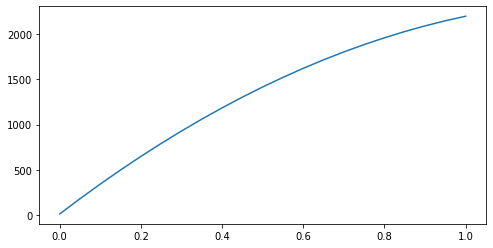
Here's a plot of the resulting PLF. PLF should generally be in the [0, 1] range, here it explodes to more than 2200.
The python code I used to plot it
def plf(flow_fraction):
    c1 = 10.553
    c2 = 3432.2
    c3 = -1244.2
    c4 = 0.0
    c5 = 0.0
    return (
        c1 +
        c2*flow_fraction +
        c3 * pow(flow_fraction, 2) +
        c4 * pow(flow_fraction, 3) +
        c5 * pow(flow_fraction, 4)
    )

flow_fractions = np.arange(0, 1.01, 0.05)
plfs = plf(flow_fractions)

fig, ax = plt.subplots(figsize=(8, 4))
ax.plot(flow_fractions, plfs)
| | 2 | No.2 Revision |
The coefficients make no sense.
Here's a plot of the resulting PLF. PLF should generally be in the [0, 1] range, here it explodes to more than 2200.
See the I/O reference: https://bigladdersoftware.com/epx/docs/23-1/input-output-reference/group-fans.html#field-fan-power-coefficient-1
The python code I used to plot it
def plf(flow_fraction):
    c1 = 10.553
    c2 = 3432.2
    c3 = -1244.2
    c4 = 0.0
    c5 = 0.0
    return (
        c1 +
        c2*flow_fraction +
        c3 * pow(flow_fraction, 2) +
        c4 * pow(flow_fraction, 3) +
        c5 * pow(flow_fraction, 4)
    )

flow_fractions = np.arange(0, 1.01, 0.05)
plfs = plf(flow_fractions)

fig, ax = plt.subplots(figsize=(8, 4))
ax.plot(flow_fractions, plfs)


