Question-and-Answer Resource for the Building Energy Modeling Community
First time here? Check out the Help page!
| | 1 | initial version |
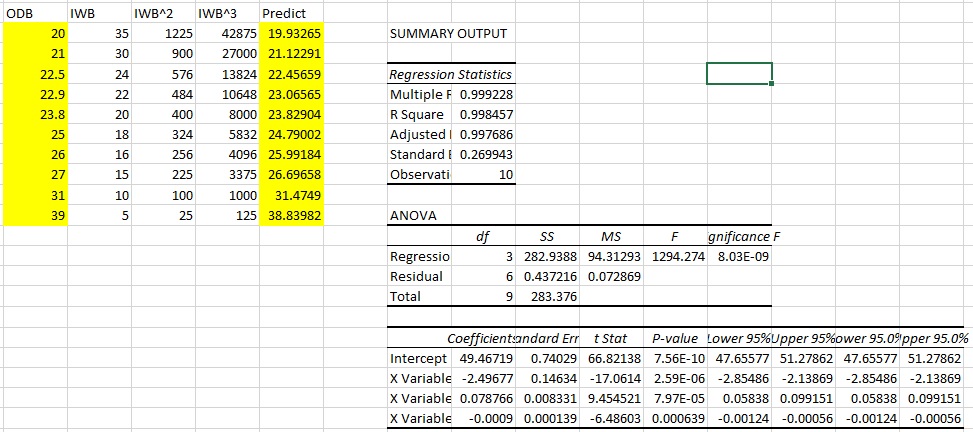
For the boundary curve, you should predict ODB given IWB, as I show in the spreadsheet. To plot these points on the same graph as CapFT vs ODB, you need to convert the IWB used to regress the boundary curve to a CapFT value at the intersection of the low and high curves. This is simple since the low curves are flat vs IWB. So for each IWB, swap out the low CapFT value and then plot the boundary curve using the "IWB converted to CapFT" vs ODB (or CAPFTiwb vs ODB).
Don't forget you can use table objects to describe performance.
http://www.fsec.ucf.edu/en/publications/pdf/FSEC-CR-1910-12.pdf If anyone is interested in doing this, Figure 6 shows how and you would only need the one table and NOT need the boundary curve or the high ODB curve (if I remember correctly).
| | 2 | No.2 Revision |
For the boundary curve, you should predict ODB given IWB, as I show in the spreadsheet. To plot these points on the same graph as CapFT vs ODB, you need to convert the IWB used to regress the boundary curve to a CapFT value at the intersection of the low and high curves. This is simple since the low curves are flat vs ODB for each IWB. So for each IWB, swap out the low CapFT value and then plot the boundary curve using the "IWB converted to CapFT" vs ODB (or CAPFTiwb vs ODB).
Don't forget you can use table objects to describe performance.
http://www.fsec.ucf.edu/en/publications/pdf/FSEC-CR-1910-12.pdf If anyone is interested in doing this, Figure 6 shows how and you would only need the one table and NOT need the boundary curve or the high ODB curve (if I remember correctly).


