Question-and-Answer Resource for the Building Energy Modeling Community
First time here? Check out the Help page!
| | 1 | initial version |
The curve in question is SteamFCondTemp (referenced from the Big Chiller here)
  Curve:Cubic,
    SteamFCondTemp,          !- Name
    0.712019,                !- Coefficient1 Constant
    -0.00478,                !- Coefficient2 x
    0.000864,                !- Coefficient3 x**2
    -0.000013,               !- Coefficient4 x**3
    7.0,                     !- Minimum Value of x
    30.0,                    !- Maximum Value of x
    ,                        !- Minimum Curve Output
    ,                        !- Maximum Curve Output
    Temperature,             !- Input Unit Type for X
    Dimensionless; !- Output Unit Type
Go ahead and type that in a google search bar: 0.712019-0.00478*x+0.000864*x**2-0.000013*x**3, see here.
Remember that the range of acceptable values is $x \in [7, 30]$. That doesn't look like a reduction to me. I also plotted the curve with the right limits myself:
| | 2 | No.2 Revision |
The curve in question is SteamFCondTemp (referenced from the Big Chiller here)
  Curve:Cubic,
    SteamFCondTemp,          !- Name
    0.712019,                !- Coefficient1 Constant
    -0.00478,                !- Coefficient2 x
    0.000864,                !- Coefficient3 x**2
    -0.000013,               !- Coefficient4 x**3
    7.0,                     !- Minimum Value of x
    30.0,                    !- Maximum Value of x
    ,                        !- Minimum Curve Output
    ,                        !- Maximum Curve Output
    Temperature,             !- Input Unit Type for X
    Dimensionless; !- Output Unit Type
Go ahead and type that in a google search bar: 0.712019-0.00478*x+0.000864*x**2-0.000013*x**3, see here.
Remember that the range of acceptable values is $x \in [7, 30]$. That doesn't look like a reduction to me. I also plotted the curve with the right limits myself:

| | 3 | No.3 Revision |
The curve in question is SteamFCondTemp (referenced from the Big Chiller here)
  Curve:Cubic,
    SteamFCondTemp,          !- Name
    0.712019,                !- Coefficient1 Constant
    -0.00478,                !- Coefficient2 x
    0.000864,                !- Coefficient3 x**2
    -0.000013,               !- Coefficient4 x**3
    7.0,                     !- Minimum Value of x
    30.0,                    !- Maximum Value of x
    ,                        !- Minimum Curve Output
    ,                        !- Maximum Curve Output
    Temperature,             !- Input Unit Type for X
    Dimensionless; !- Output Unit Type
Go ahead and type that in a google search bar: 0.712019-0.00478*x+0.000864*x**2-0.000013*x**3, see here.
Remember that the range of acceptable values is $x \in [7, 30]$. That doesn't look like a reduction to me. I also plotted the curve with the right limits myself:
| | 4 | No.4 Revision |
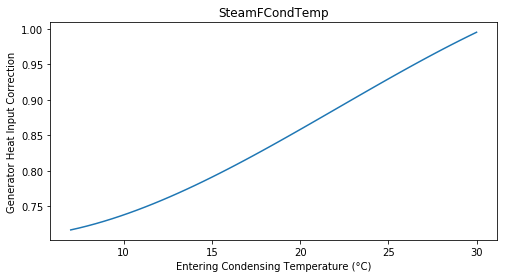
The curve in question is SteamFCondTemp (referenced from the Big Chiller here)
  Curve:Cubic,
    SteamFCondTemp,          !- Name
    0.712019,                !- Coefficient1 Constant
    -0.00478,                !- Coefficient2 x
    0.000864,                !- Coefficient3 x**2
    -0.000013,               !- Coefficient4 x**3
    7.0,                     !- Minimum Value of x
    30.0,                    !- Maximum Value of x
    ,                        !- Minimum Curve Output
    ,                        !- Maximum Curve Output
    Temperature,             !- Input Unit Type for X
    Dimensionless; !- Output Unit Type
Go ahead and type that in a google search bar: 0.712019-0.00478*x+0.000864*x**2-0.000013*x**3, see here.
Remember that the range of acceptable values is $x \in [7, 30]$. That doesn't look like a reduction to me. I also plotted the curve with the right limits myself:
As far as where these are coming from, no clue, I couldn't find any mention of it.


