Question-and-Answer Resource for the Building Energy Modeling Community
First time here? Check out the Help page!
| | 1 | initial version |
I have been using E+ as a practioner for a long time now and one of the issues we had here in the office was the data input time. So we started to use excel to make this much much quicker. We often have models that have 400-500 thermal zones and we use excel to detail out all the inputs that we need and then write it to idf code. Below is an example of how we put people, equipment and lighting into the model:
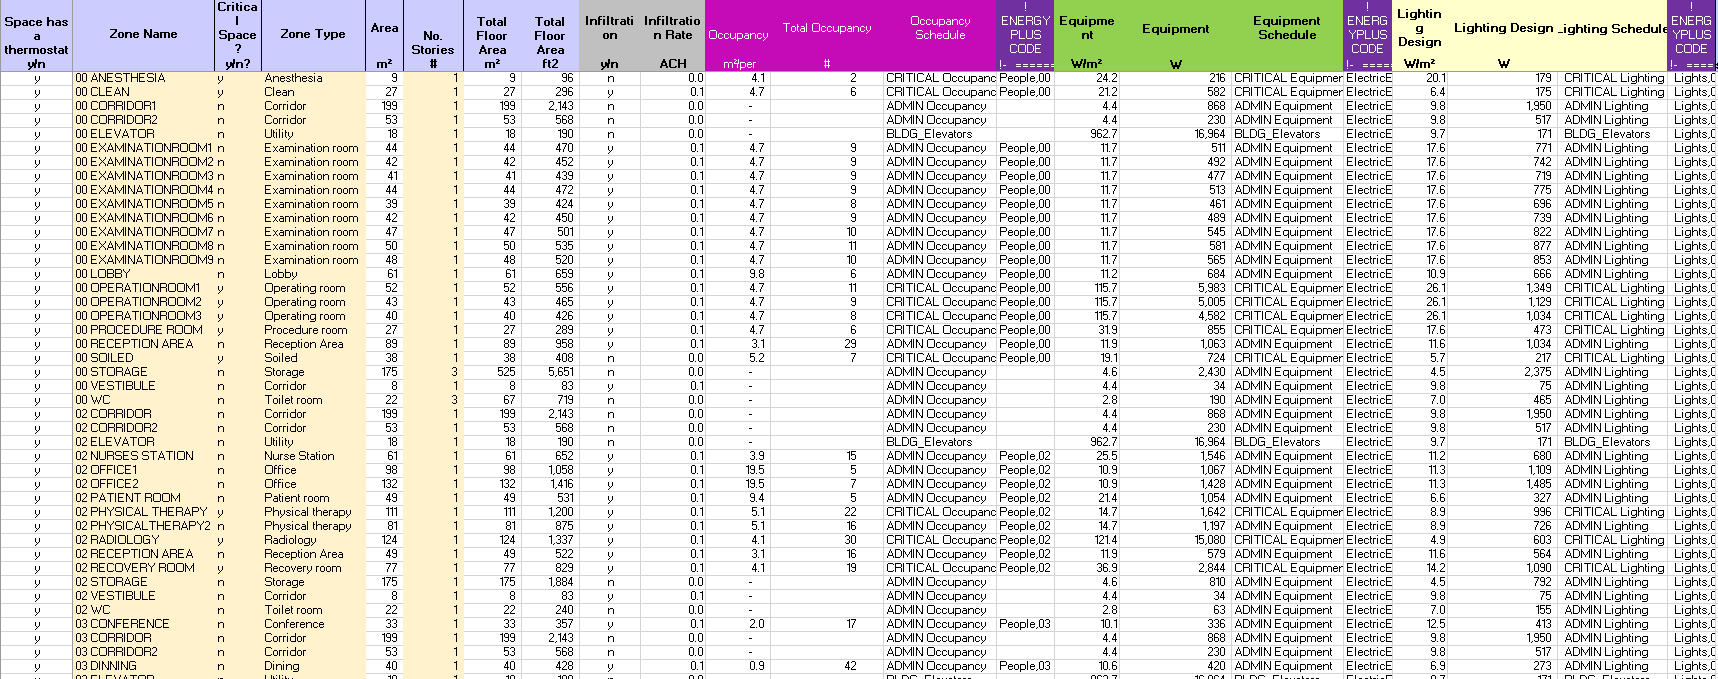
The yellow boxes we fill in by hand, everything else gets filled in automatically from the input verification file from e+ and from the zone types chosen. the purple columns are the EnergyPlus input data that can be directly pasted into the text file.
We do a similar process with the HVAC, have one sheet that details out what is in the model, the spreadsheet that creates the HVAC input data however is much larger. The main advantage though is that we can leverage the functionality of excel (copy down, formulas etc...) and then write directly into the text editor. It also makes the file easier to manipulate, if the lighting levels change for instance, you change it in the spreadsheet, delete all the object in e+ and then just replace them with the spreadsheet code.
When it comes to App G baseline stuff, there are a ton of equations and rules that are spelled out in App G. We basically have a spreadsheet which will calculate all these bits and pieces to ensure that the correct information is written into the idf file. Again leveraging the functionality of excel.
Finally we also do geometry manipulation but this is often less clean. We do a lot of models with Radiant ceilings. To put these into the model via OpenStudio plugin would take us many many hours, so we have a spreadsheet that finds all the zones with chilled ceilings, then all the surfaces and replaces the constructions on those that have chilled ceilings with an internal source construction. It will also create the surface groups for each zone.
Let me know if you have any specific examples or questions in mind and I would happily answer them. I love our data manipulation with excel, it has halved our input times at least and improved our accuracy significantly.

