Question-and-Answer Resource for the Building Energy Modeling Community
First time here? Check out the Help page!
| | 1 | initial version |
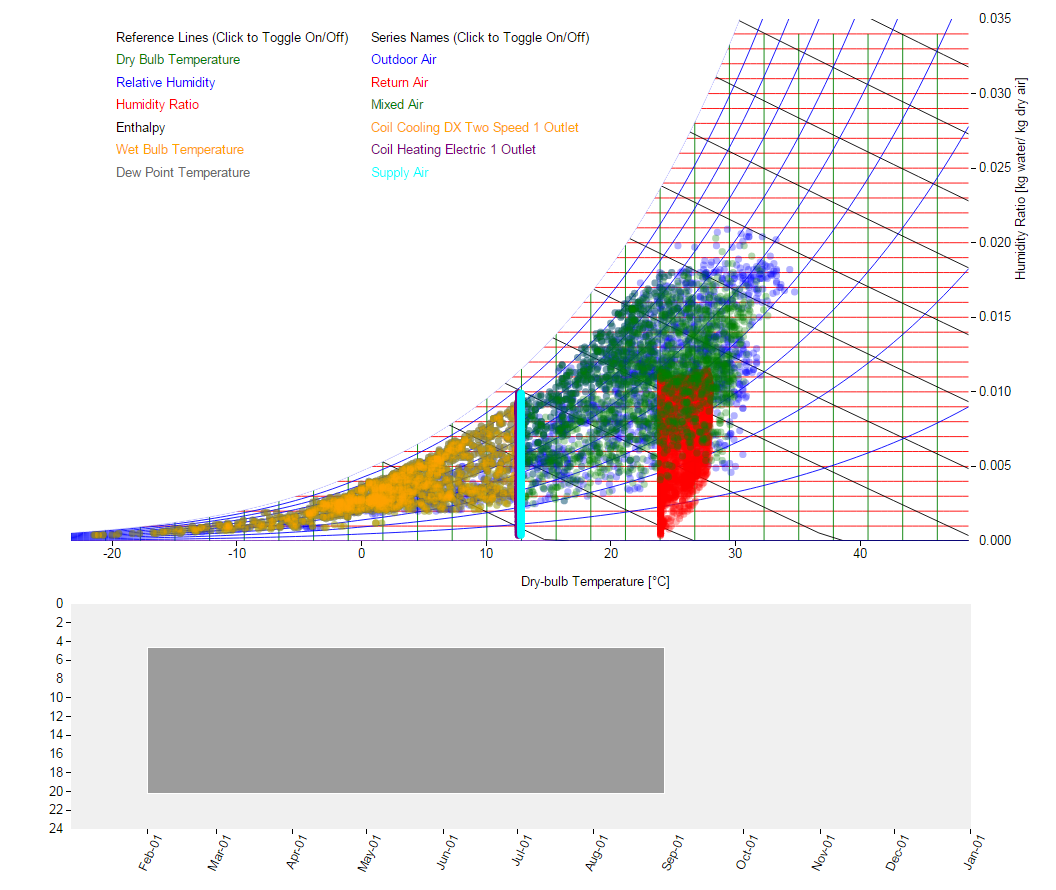
@aparker has implemented an interactive psych chart as a reporting measure. Here's what it looks like:
I've pinged him for info on what repo it lives in, and I will update this post with that information when he gets back to me.
| | 2 | No.2 Revision |
@aparker has implemented an interactive a psych chart as a reporting measure. Here's what it looks like:
The gray box at the bottom is interactive and allows you to filter the results based on period of time. I've pinged him for info on what repo it lives in, and I will update this post with that information when he gets back to me.


