This question is 3 years old, so maybe you have figured out the answer.
The hysteresis model is adapted from (Egolf and Manz 1994) study, and the idea is to convert a continuous function of enthalpy to a discontinuous function.
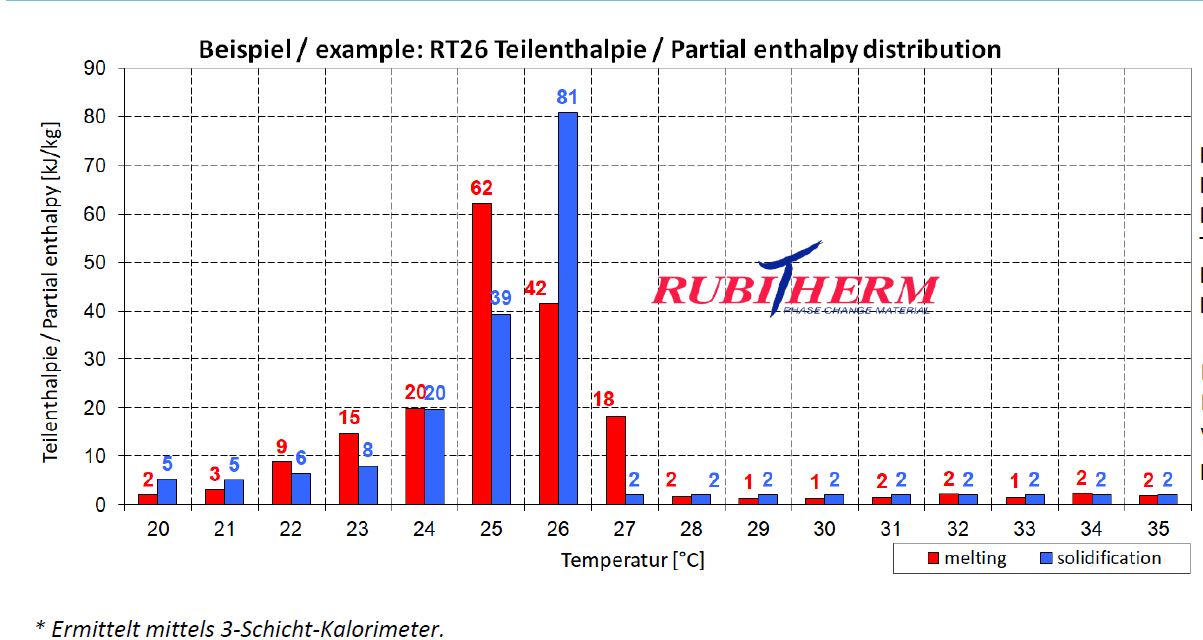
- Question : there is any solution to get numbers for material property:phase change from this chart as it needs increasing values like ordinary enthalpy curves, not partial enthalpy.
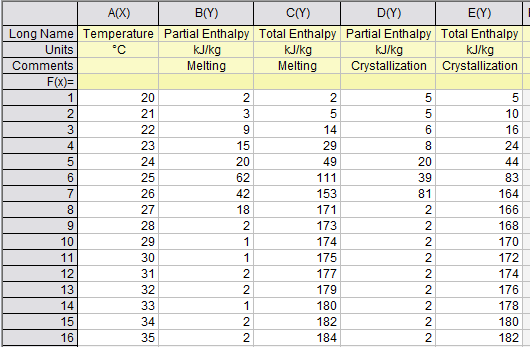
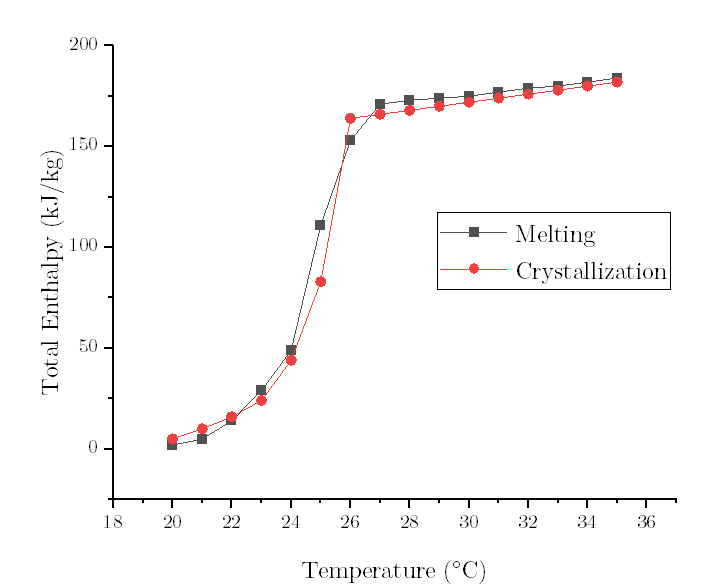
To get the continuing (increasing values like ordinary enthalpy curves) enthalpy chart, you only sum the partial enthalpy with the previous values. For example, htot(23) = hpart(23) + hpart(22) + hpart(21) + hpart(20); and so on for each temperature.
To create a continuous enthalpy chart (increasing values like ordinary enthalpy curves), simply accumulate the partial enthalpy values for each temperature with the previous ones. For instance, htot(23) = hpart(23) + hpart(22) + hpart(21) + hpart(20).
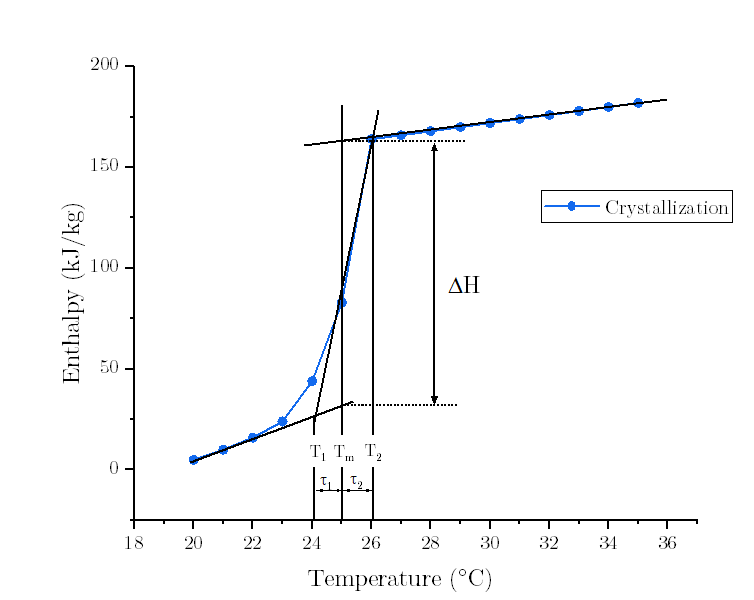
- Question : high/low temperature differences of melting /solidification curve
Let's take the freezing curve as an example.
Upon the InputOutput Document, the Low/High Temperature Difference of Freezing Curve (tau1/tau2) are defined as the width of the enthalpy/specific heat freezing curve, on the low/high side of the peak freezing temperature. Simply, tau1 = T1-Tf; tau2 = Tf-T2, where Tf is the Peak Freezing Temperature defined as the center (peak) of the freezing curve.
Also see : EnergyPlus Fortran Documentation and The transition process model