Question-and-Answer Resource for the Building Energy Modeling Community
| | 1 | initial version |
This question is 3 years old, so maybe you have figured out the answer.
The hysteresis model is adapted from (Egolf and Manz 1994) study, and the idea is to convert a continuous function of enthalpy to a discontinuous function.
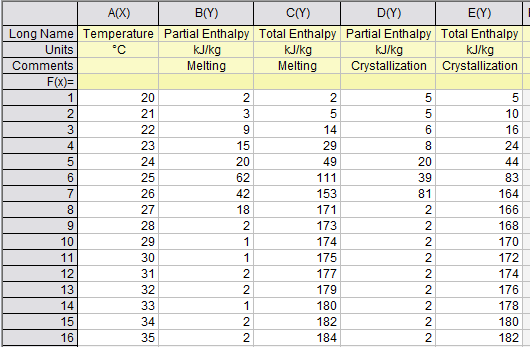
To get the continuing (increasing values like ordinary enthalpy curves) enthalpy chart, you only sum the partial enthalpy with the previous values. For example, htot(23) = hpart(23) + hpart(22) + hpart(21) + hpart(20); and so on for each temperature.
To create a continuous enthalpy chart (increasing values like ordinary enthalpy curves), simply accumulate the partial enthalpy values for each temperature with the previous ones. For instance, htot(23) = hpart(23) + hpart(22) + hpart(21) + hpart(20).
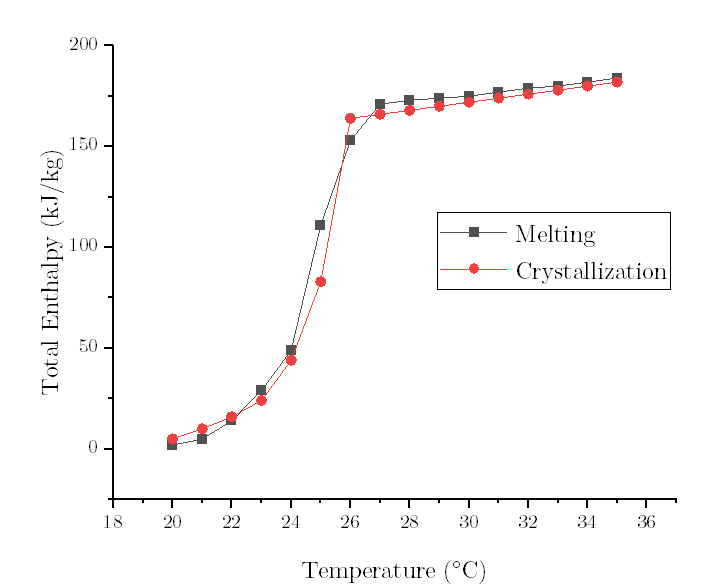
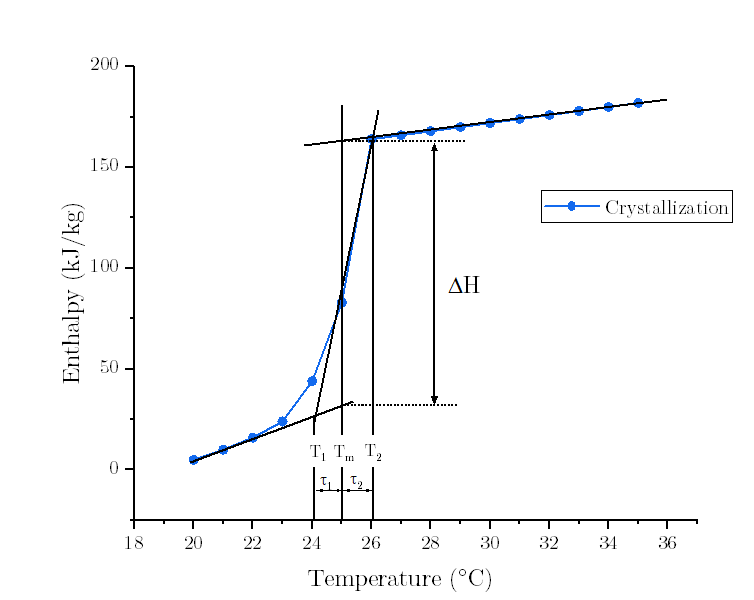
Let's take the freezing curve as an example.
Upon the InputOutput Document, the Low/High Temperature Difference of Freezing Curve (tau1/tau2) are defined as the width of the enthalpy/specific heat freezing curve, on the low/high side of the peak freezing temperature. Simply, tau1 = T1-Tf; tau2 = Tf-T2, where Tf is the Peak Freezing Temperature defined as the center (peak) of the freezing curve.
| | 2 | No.2 Revision |
This question is 3 years old, so maybe you have figured out the answer.
The hysteresis model is adapted from (Egolf and Manz 1994) study, and the idea is to convert a continuous function of enthalpy to a discontinuous function.
To get the continuing (increasing values like ordinary enthalpy curves) enthalpy chart, you only sum the partial enthalpy with the previous values. For example, htot(23) = hpart(23) + hpart(22) + hpart(21) + hpart(20); and so on for each temperature.
To create a continuous enthalpy chart (increasing values like ordinary enthalpy curves), simply accumulate the partial enthalpy values for each temperature with the previous ones. For instance, htot(23) = hpart(23) + hpart(22) + hpart(21) + hpart(20).
Let's take the freezing curve as an example.
Upon the InputOutput Document, the Low/High Temperature Difference of Freezing Curve (tau1/tau2) are defined as the width of the enthalpy/specific heat freezing curve, on the low/high side of the peak freezing temperature. Simply, tau1 = T1-Tf; tau2 = Tf-T2, where Tf is the Peak Freezing Temperature defined as the center (peak) of the freezing curve.
Also see : EnergyPlus Fortran Documentation and The transition process model

