 | 1 | initial version |
I can help you get into the Sqlite files. On free tool in windows is "sqlitebrowser" which can be installed here: https://sqlitebrowser.org/dl/. There are other database IDE's (Dbeaver being another good one) but if you just need sqlite3 browsing this should work.
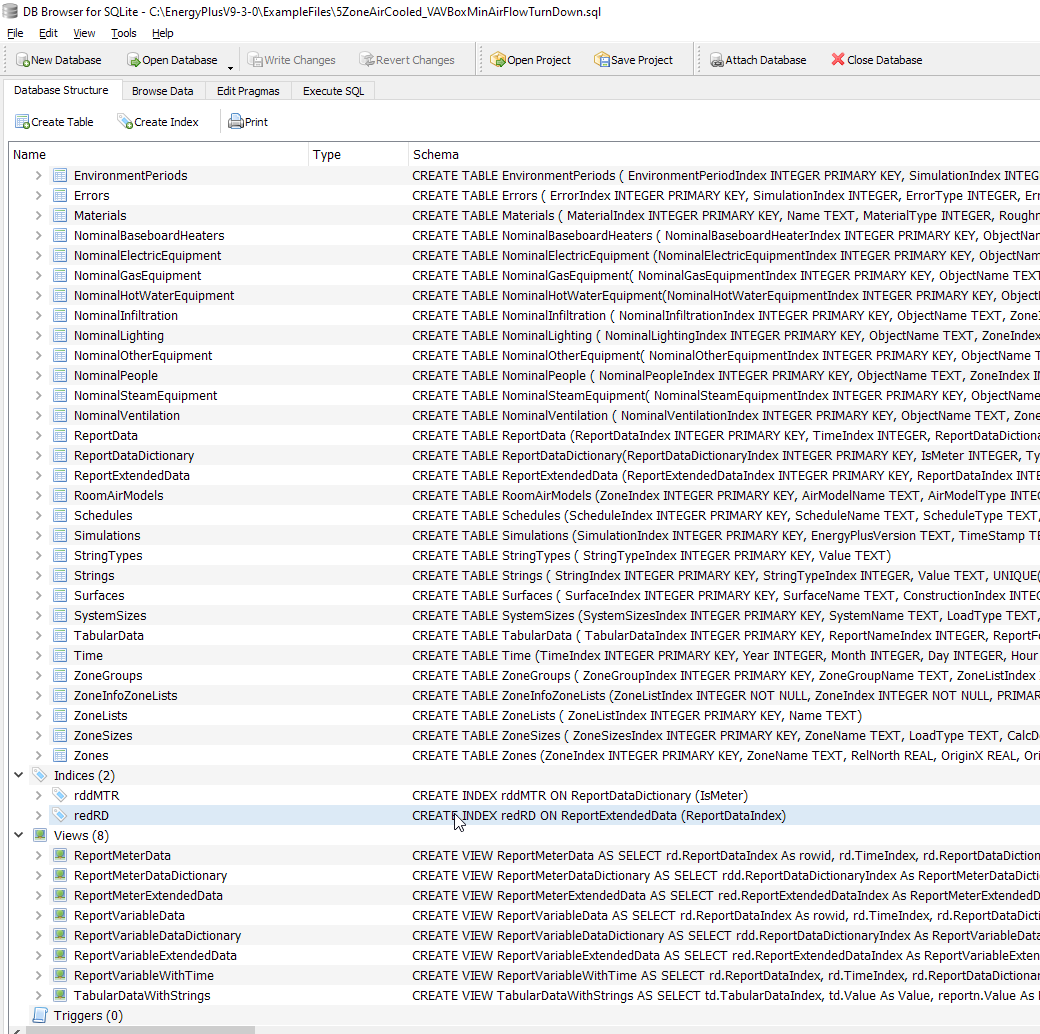
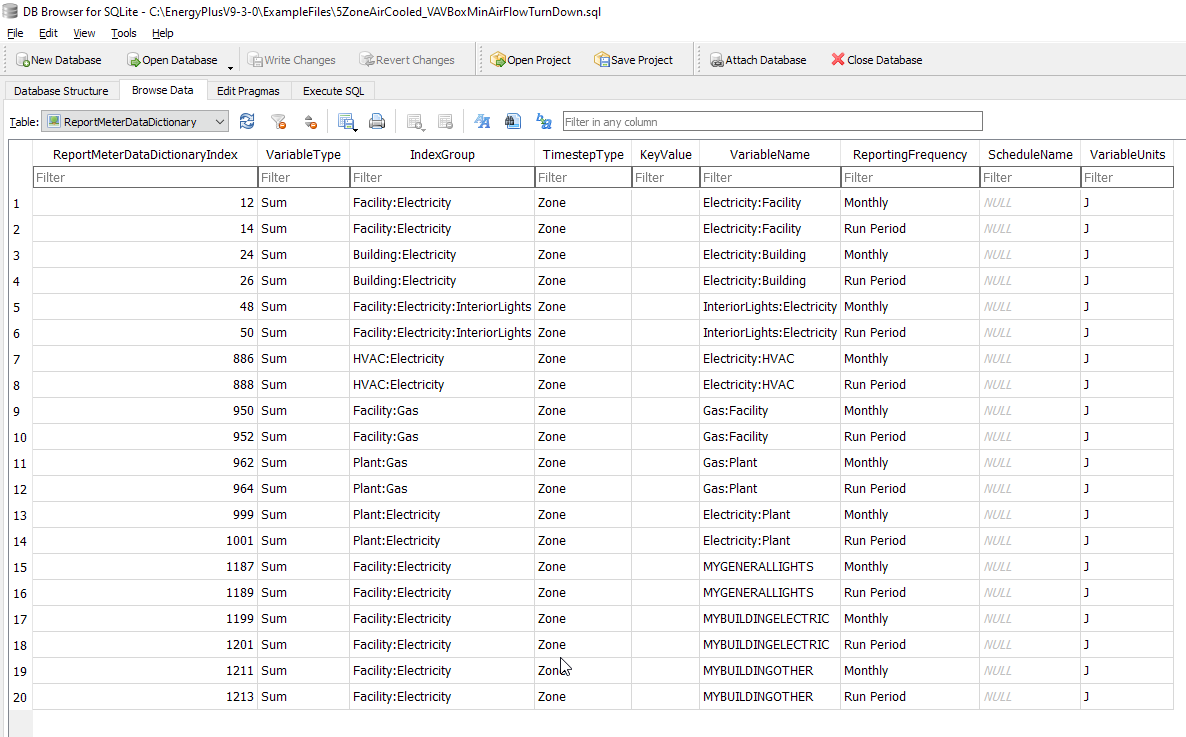
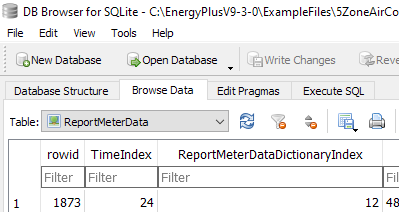
Now an incomplete summary of the Sqlite structure is shown in the next 3 images:
Table Structure of the SQLITE Outputs:

Data Elements of the Meters that are outputs as reports:

The location of the observations for each meter:

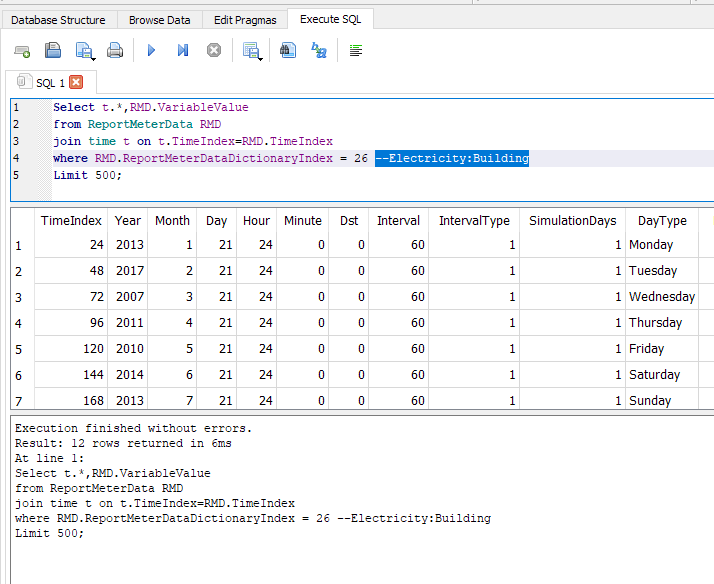
Now for an example, if you wanted to return all of the results of "Electricity:Building" for each run period you could use the following query in the "Execute Query" tab. To return all results remove the final line "Limit 500" or comment it our with two dashes before the line "--".
Select t.*,RMD.VariableValue
from ReportMeterData RMD
join time t on t.TimeIndex=RMD.TimeIndex
where RMD.ReportMeterDataDictionaryIndex = 26  --Electricity:Building
Limit 500;
Image of the following query is here:

Per your question of joining the two sql lite files I don't think this is feasible but I haven't looked into Dview. By using these queries you could also setup Python to extract the values you want and visualize both of them in a Python visualization. This link could help if you explored that path further: https://docs.python.org/3/library/sqlite3.html.
