Question-and-Answer Resource for the Building Energy Modeling Community
First time here? Check out the Help page!
| 2022-08-01 14:40:48 -0500 | asked a question | Using Energyplus "Building" component to meter multiple buildings in one idf file Using Energyplus "Building" component to meter multiple buildings in one idf file Hello community. Working on a projec |
| 2021-12-15 08:46:26 -0500 | commented question | E+ chiller sizing reported on equipment summary way higher than expected and from hourly results @luis Lara, I just re-ran one of the idf files and uploaded all the files. You should be able to download the idf files |
| 2021-12-14 09:11:34 -0500 | edited question | E+ chiller sizing reported on equipment summary way higher than expected and from hourly results E+ chiller sizing reported on equipment summary way higher than expected and from hourly results Working on an office re |
| 2021-12-14 09:05:02 -0500 | edited question | E+ chiller sizing reported on equipment summary way higher than expected and from hourly results E+ chiller sizing reported on equipment summary way higher than expected and from hourly results Working on an office re |
| 2021-12-14 08:57:51 -0500 | edited question | E+ chiller sizing reported on equipment summary way higher than expected and from hourly results E+ chiller sizing reported on equipment summary way higher than expected and from hourly results Working on an office re |
| 2021-12-14 08:56:27 -0500 | edited question | E+ chiller sizing reported on equipment summary way higher than expected and from hourly results E+ chiller sizing reported on equipment summary way higher than expected and from hourly results Working on an office re |
| 2021-12-14 08:56:00 -0500 | edited question | E+ chiller sizing reported on equipment summary way higher than expected and from hourly results E+ chiller sizing reported on equipment summary way higher than expected and from hourly results Working on an office re |
| 2021-12-14 08:55:36 -0500 | edited question | E+ chiller sizing reported on equipment summary way higher than expected and from hourly results E+ chiller sizing reported on equipment summary way higher than expected and from hourly results Working on an office re |
| 2021-12-10 11:34:37 -0500 | commented answer | E+ chiller sizing reported on equipment summary way higher than expected and from hourly results Very good points @luis Lara, I will look into the sizing period runs and export the COP and chiller evaporator cooling r |
| 2021-12-10 10:23:05 -0500 | asked a question | E+ chiller sizing reported on equipment summary way higher than expected and from hourly results E+ chiller sizing reported on equipment summary way higher than expected and from hourly results Working on an office re |
| 2021-12-10 10:23:00 -0500 | asked a question | E+ chiller sizing reported on equipment summary way higher than expected and from hourly results E+ chiller sizing reported on equipment summary way higher than expected and from hourly results Working on an office re |
| 2021-12-10 09:40:30 -0500 | received badge | ● Popular Question (source) |
| 2021-10-05 14:30:24 -0500 | commented answer | Help with Sketchup Plugin Install issue? @Ed thanks for the detailed comments. I am having similar issues with both SKP 2019 and 2021 versions. Sometimes my SKP |
| 2020-11-09 08:54:17 -0500 | answered a question | Finding Degenerate Surfaces in EnergyPlus I was too excited not to post this solution! It is low-tech excel solution but works. I get the name of degenrate surfac |
| 2019-02-15 10:53:04 -0500 | answered a question | Standard Effective Temperature (SET) outputs from Energyplus I added an issue item to the Energyplys development team. If you feel like this is needed for your purposes, upvote that |
| 2019-02-07 10:22:26 -0500 | commented answer | Standard Effective Temperature (SET) outputs from Energyplus Thanks @Eric Ringold, yest it does - the issue is it only reports out the PMV values and not the SET values used in calc |
| 2019-02-07 09:43:46 -0500 | asked a question | Standard Effective Temperature (SET) outputs from Energyplus Standard Effective Temperature (SET) outputs from Energyplus Hello Community! Does anyone know if there is a simple wa |
| 2019-02-07 09:34:04 -0500 | commented answer | View_Data Measure Reporting Adjustments @David Goldwasser - having only recently looked at this measure, which is a fantastic one, I have a few suggestions: - I |
| 2018-10-30 08:37:48 -0500 | received badge | ● Critic (source) |
| 2018-09-05 22:05:51 -0500 | received badge | ● Enthusiast |
| 2018-08-27 13:23:46 -0500 | commented answer | eQuest Geometry to EnergyPlus Funny thing is I had gotten this to work, I think in an older version of OS installation but now that I am working on an |
| 2018-08-27 13:22:23 -0500 | commented answer | eQuest Geometry to EnergyPlus @anchapin, @Phylroy Lopez and @macumber - I am following the steps here and am getting an error with a "method". Thought |
| 2017-10-31 08:58:03 -0500 | asked a question | Clarification needed - Report: Sensible Heat Gain Summary Clarification needed - Report: Sensible Heat Gain Summary Can someone once and for all help me understand the Sensible H |
| 2017-10-13 16:43:19 -0500 | commented question | ASHRAE RP-1651 versus AEDG 50% Hospital Benchmark @rraustad that is a great question and I noticed it too but that came directly out of the published data and I can't spe |
| 2017-09-28 15:34:36 -0500 | commented question | ASHRAE RP-1651 versus AEDG 50% Hospital Benchmark Thanks @David Goldwasser. I am specifically looking for the source idfs to dig into the differences. DOE does a great jo |
| 2017-09-28 14:20:31 -0500 | asked a question | ASHRAE RP-1651 versus AEDG 50% Hospital Benchmark ASHRAE RP-1651 versus AEDG 50% Hospital Benchmark It has been by chance that I looked at both the RP-1651 and the AEDG r |
| 2017-02-01 11:19:43 -0500 | commented answer | What are some good programs/applications to use as a text editor for EnergyPlus models? @eayoungs, would you be able to upload the "EnergyPlus.tmLanguage" file somewhere so that we can directly download that? I followed the steps but am having trouble converting the YAML-tmLanguage file to .tmLanguage. |
| 2017-01-27 09:52:22 -0500 | commented question | linking Genopt with TRNSYS for optimization |
| 2017-01-25 13:39:11 -0500 | answered a question | Visualizing Airflow between zones in EnergyPlus Check this tool out: https://www.ods-engineering.com/tools... He has really good visualization capabilities. |
| 2017-01-06 10:04:55 -0500 | commented answer | Create a dummy Output:Variable in EnergyPlus Btw, be very careful with the EPMacro function syntax, it is very unforgiving of the spaces and brackets between operators! |
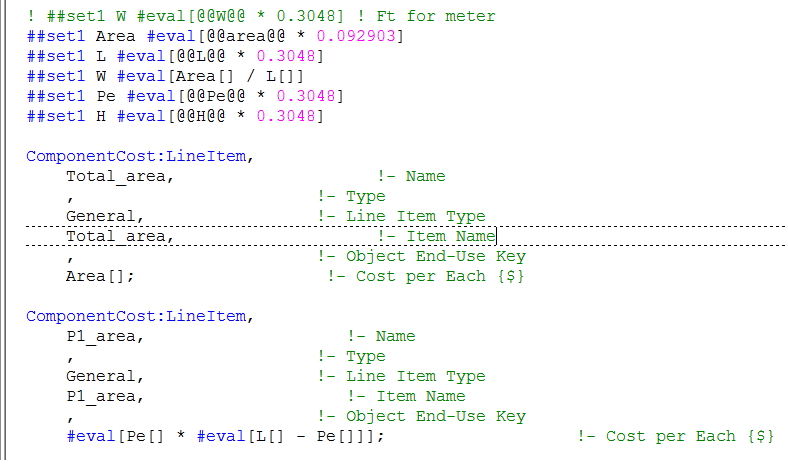
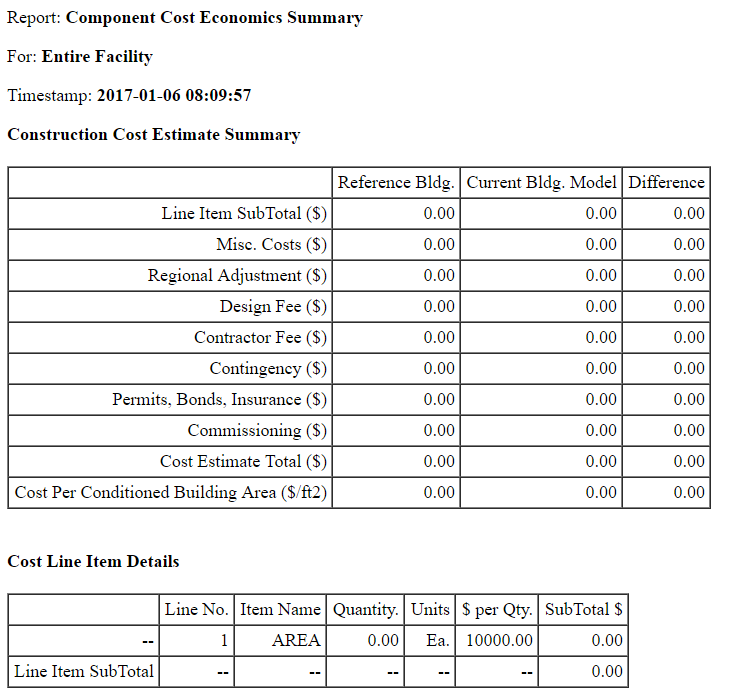
| 2017-01-06 09:57:49 -0500 | answered a question | Create a dummy Output:Variable in EnergyPlus @antonszilasi, I believe the "ComponentCost:LineItem" object in E+ would do the trick for you and if you add the economics output report you would be able to access your cost data in outputs. Technically you should be OK using this for your single line cost data to be accessed in the outputs but say you want to perform some sort of math to post-process an output variable, then you can use EPMacro capabilities to do your calculations within the .imf file and it can be stored in this cost object as a dummy placeholder that then you can access after E+ is run. See example below where I am trying to pass on my total area parametrically in conjunction with jEplus+EA engine. Then I am using the variables passed on from jEplus to calculate the areas of individual zones from dimensions. I store the areas for each zone in one of the lineItem objects and read them later from .csv file to pass back to jEPlus for further calculations. Check jEplus+EA documentation and examples too btw, they have great examples on the use of EPMacro.
Output:Table:SummaryReports, ComponentCostEconomicsSummary; !- Report 1 Name
|
| 2016-12-06 15:10:18 -0500 | commented answer | Plug loads estimate from electrical wiring capacity Thanks @mdahlhausen. Measurement is obviously the best way to approach this. I just keep wondering if there is a published document somewhere, perhaps from a utility company or ASHRAE, that has good estimates based on the wiring capacity calculations! |
| 2016-12-06 10:24:42 -0500 | asked a question | Plug loads estimate from electrical wiring capacity This is mostly a plug loads estimate question. Recently, while working on a hotel project we were asked to estimate the PV capacity required for which the energy model developed for LEED was requested to be used. The electrical engineer's estimate of total building electricity need came much higher than the one from the energy model. After investigating it turned out that the electrical engineer was basing his estimate on the total electrical wiring capacity which came to about 12 W/ft2 of electrical load versus the energy model which was based on traditional plug loads assumptions amounting to about 2 W/ft2 including lighting. This hotel has suites with major appliances and that is why the total wiring load Wattage is quite high. We weren't able to find resources to justify the actual diversity factor for the building loads and went with the assumption that very few guests use those appliances on a regular basis plus the fact that the building occupancy rate is well below 100%. It gets harder to estimate loads for a hotel project but one can imagine a similar conversation about an office building. I am wondering if anyone has experience with estimating plug loads from the electrical wiring calculations that can share? Obviously, measured data would help with these sort of questions but I am specifically interested in best-practice examples that can be drawn from the electrical design documents with reasonable accuracy. |
| 2016-11-01 06:49:54 -0500 | commented answer | Shading Design - Surface Outside Face Sunlit Fraction Thanks Tian, do you know if there is a threshold or as long as direct beam hits the surface that hour/timestep counts? |
| 2016-10-31 12:32:29 -0500 | asked a question | Shading Design - Surface Outside Face Sunlit Fraction I am trying to use this E+ variable to gauge effectiveness of a few shading strategies in conjunction with some more complicated daylighting tools. The sunlit fraction definition says it looks at unreflected beam solar radiation at each time step to calculate the fraction. Anyone knows how it actually determines the unreflected versus reflected solar radiation? Is there a daylight (lux) or energy (W/ft2) threshold by which E+ determines that? I wasn’t able to find anything in the E+ documentation! It is important to know how this unreflected beam radiation is determined since we are trying to model a detailed shading strategy in LightStanza to calculate a similar metric (Sunlit Fraction) for the whole year then use simple shading objects (overhangs) in E+ to mimic that with performance by comparing to a metric that looks at the number of hours direct sun hits the windows. That threshold definition dictates how we would calculate from LightStanza.
|
| 2016-09-13 13:09:16 -0500 | commented question | One-time peak demand tariff calculation Thanks @MatthewSteen. |
| 2016-09-13 13:08:52 -0500 | commented answer | One-time peak demand tariff calculation Thanks for confirming my thoughts, originally I thought the object adds up all the occurrences of the demand exceeding the window but now I realize it only picks the one that has the highest peak demand which is exactly what I needed. Voted for the new feature to be added. |
| 2016-09-13 08:39:45 -0500 | commented question | One-time peak demand tariff calculation @JasonGlazer and @David Goldwasser, I know you both have posted about this before. Any suggestions on how to effectively get that hourly data out? |
| 2016-09-13 08:38:31 -0500 | asked a question | One-time peak demand tariff calculation I am analyzing a building for which the electricity demand tariff is calculated only based on the one-time highest monthly peak calculated over 15 min intervals. It is my understanding that the "Demand Window Length" specified in the tariff object counts every single one of the peak occurrences exceeding that window which is way higher than what a one-time demand charge would be. Is there a way to force the tariff to only calculated the peak demand for a one-time monthly occurrence? Also, based on this post it looks like there is no way to get hourly data out of E+. I need that hourly data to:
Any thoughts? |
| 2016-04-27 17:38:07 -0500 | asked a question | ASHRAE Baseline system 3 - High Fan Energy I am working on LEED modeling for a project that the design has 1 rooftop, DX cooling, HW heating unit with VAV HW reheat at the zone level. The size and number of floors dictate the use of App G System 3 (packaged rooftop air conditioner) with constant volume fans, DX cooling and gas heating coils for ALL the thermal zones. Our calculations for the baseline fan pressure drops based on App G formulas show relatively higher pressure drops compared to the ones for the design case. Even compared to the formulas for the System 1 and 2, the fan pressure drops are more than 2 times higher in the 4-5 inch water range compared to AHU fan pressure drops around 3 inch water. I think the questions below are more on clarification on 90.1 intent behind fan pressure drop calcs for these single zine units. This is probably the only time that a single zone system is dominating the baseline I am modeling and I am not sure if the results I am seeing make sense compared to the design case.
Thanks. |
| 2016-04-26 19:10:06 -0500 | commented question | How to collect more data from SQL from JEPLUS-EA runs (output files) @Xandrika - is it possible for you to share with me a set of example files that runs on the "jEPlus+EA_v1.7.6_beta" version or any other version that you have had success with? I am just starting with jePlus+EA for a project and am experiencing similar errors as you have been in your posts. My contact information can be found on my profile. Thank you. |
| 2016-01-29 06:48:51 -0500 | commented answer | OS results viewer in Sketchup plugin Thanks for clarification @Julien Marrec |
| 2016-01-28 15:29:39 -0500 | asked a question | OS results viewer in Sketchup plugin Does anyone know how I can get the results viewer tabs for the Sketchup plugin in the video below? When I install the OS it doesn’t automatically show up in the plugin which makes me think that the development team has moved this feature directly to the OS application vs. the plugin? |
| 2016-01-22 09:41:51 -0500 | commented answer | How do you model operable windows? Thank you David. |
| 2016-01-19 17:15:19 -0500 | commented answer | How do you model operable windows? @David Goldwasser - did you ever put that measure together to tag different window types to be used with "WindandStackOpenArea" object? |