Question-and-Answer Resource for the Building Energy Modeling Community
First time here? Check out the Help page!
| 2017-03-17 22:18:39 -0500 | received badge | ● Editor (source) |
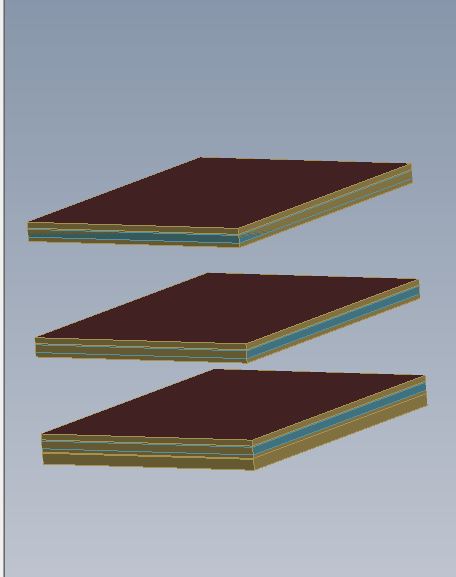
| 2017-03-17 22:18:06 -0500 | asked a question | Large office building in EnergyPlus defined as just 3 separate floors without any wall connecting them I am currently running large office building simulation on EnergyPlus and I downloaded my files directly from energyplus website. It is supposed to be 3 story building, but after running it in open studio it was just 3 separate floors without any wall connecting them together:
Can anyone tell me how I can fix this problem? Or is there any other source that I can download idf file for large office buildings that does not have this problem? |
| 2017-03-15 23:58:47 -0500 | commented question | Daily power output of solar panel below installed PV power TMY3 weather file for Miami downloaded from the Energy Plus website. No detached shading elements, only PV shading on the roof |
| 2017-03-14 22:29:51 -0500 | commented question | Daily power output of solar panel below installed PV power We did a similar calculation for annual maximum value and annual average of daily power output and noticed that only the max value was over 4.26 kWh. We used the calculator on the link you suggested. The monthly average of daily power output was between 4-5 kWh/sq.m/day. Our monthly averages were almost half this value. |
| 2017-03-14 22:29:42 -0500 | commented question | Daily power output of solar panel below installed PV power Our location is Miami. We realized that there was an error in our calculation. We used rule of thumb of 4 kWh per kW of installed PV per day to calculate the power output that we are supposed to get from our system. For a PV of 12% cell efficiency, fraction of active solar cells of 0.7 and area of 12.69 m^2, we got a value of 4.26 kW. But from the simulation's meter file, we found the minimum value of the daily power output for an entire year to be 2E07 J. That gives us 0.8 kWh per day (2E07/3600). Do these calculations look right? This value is significantly off from desired 4.26 kWh value. |
| 2017-03-11 16:03:23 -0500 | asked a question | Daily power output of solar panel below installed PV power We defined solar panel on the core zone of the roof using PhotovoltaicPerformance:Simple, assuming that the fraction of active solar cells is 0.5 and cell efficiency is 0.3. We compared the daily power output from the simulation with the power output of the installed PV and noticed that there were days when the daily power output was significantly lower. Area of core zone = 150 sq.m Area of 1 panel (assumed) = 1.5 * 05 sq.m Number of panels on core zone = 100 Rated power of each panel(assumed) = 100 W Power output of installed PV = 10 kW Minimum daily power output from annual run of simulation = 2.3 kW-h Maximum daily power output from annual run of simulation = 8.6 kW-h Do these calculations look right? The daily power output doesn't particularly follow any trend for different months. The monthly power output for the array looks right. Any idea why we get such low values for daily power output? |
| 2017-03-11 13:30:35 -0500 | asked a question | No change in electricity production after changing generator rated electricity power output? I am trying to model electricity generation produced by PV panels on a building but noticed that if I change the generator rated electricity power output I am still producing the same amount of energy. I tried to compare this with the generatorPV example file given in EnergyPlus but when I change the generator rated electricity power output values in the example file, it also does not change the power production output. Does anyone know why this occurs and if there is a way to fix this? Change in the generator rated electricity power output should change the power production output at the end of a simulation. |
| 2017-02-22 12:41:48 -0500 | asked a question | How to define last two fields for the object generator:photovoltaic? I am trying to define solar panel area coverage on the roof of a building but I do not really understand how to define the number of series strings in parallel and the number of modules in series. Do these values depend on the area of the roof being covered or the area of the solar modules/panels? How can I calculate these values? The solar panel model that I am using for this simulation is the Kyocera KC 120-1, object 43 in the SandiaPVdata data set. The dimensions of the roof for this simulation are length=27.69m, width=18.46m. Any help would be greatly appreciated! Thank you in advanced! |
| 2017-02-15 14:23:18 -0500 | received badge | ● Student (source) |
| 2017-02-15 13:53:37 -0500 | asked a question | Does anyone know where I could find an updated version of the Sandia PV built in dataset? The Sandia PV data idf file seems to be outdated; some of the solar manufacturing companies no longer produce and sell solar panels. I called the EnergyPlus help number and they redirected my question to here. Will there be an updated version of this idf file soon? If not, where can I find the raw data that was used to produce this idf file? Thank you for your help! |