Question-and-Answer Resource for the Building Energy Modeling Community
First time here? Check out the Help page!
| 2017-11-03 09:29:47 -0500 | received badge | ● Popular Question (source) |
| 2016-02-20 07:51:58 -0500 | commented answer | Metric Reports in Open Studio Hello, Here is a link to the OpenStudio Report (SI) measure that I have modified : OpenStudio Report SI I didn't double-check everything, so, as the saying goes, "use it at your own risk" |
| 2016-02-17 03:53:04 -0500 | answered a question | Issues with Switchable Glazing Solar Gain Setpoint I noticed the same issue with a screen. A blank field in OpenStudio results in 5000 W/m2 value in IDF. |
| 2016-02-15 09:34:39 -0500 | received badge | ● Teacher (source) |
| 2016-02-12 14:04:25 -0500 | commented answer | Constant vs. nighttime-reduced temperature It is : NoLimit. |
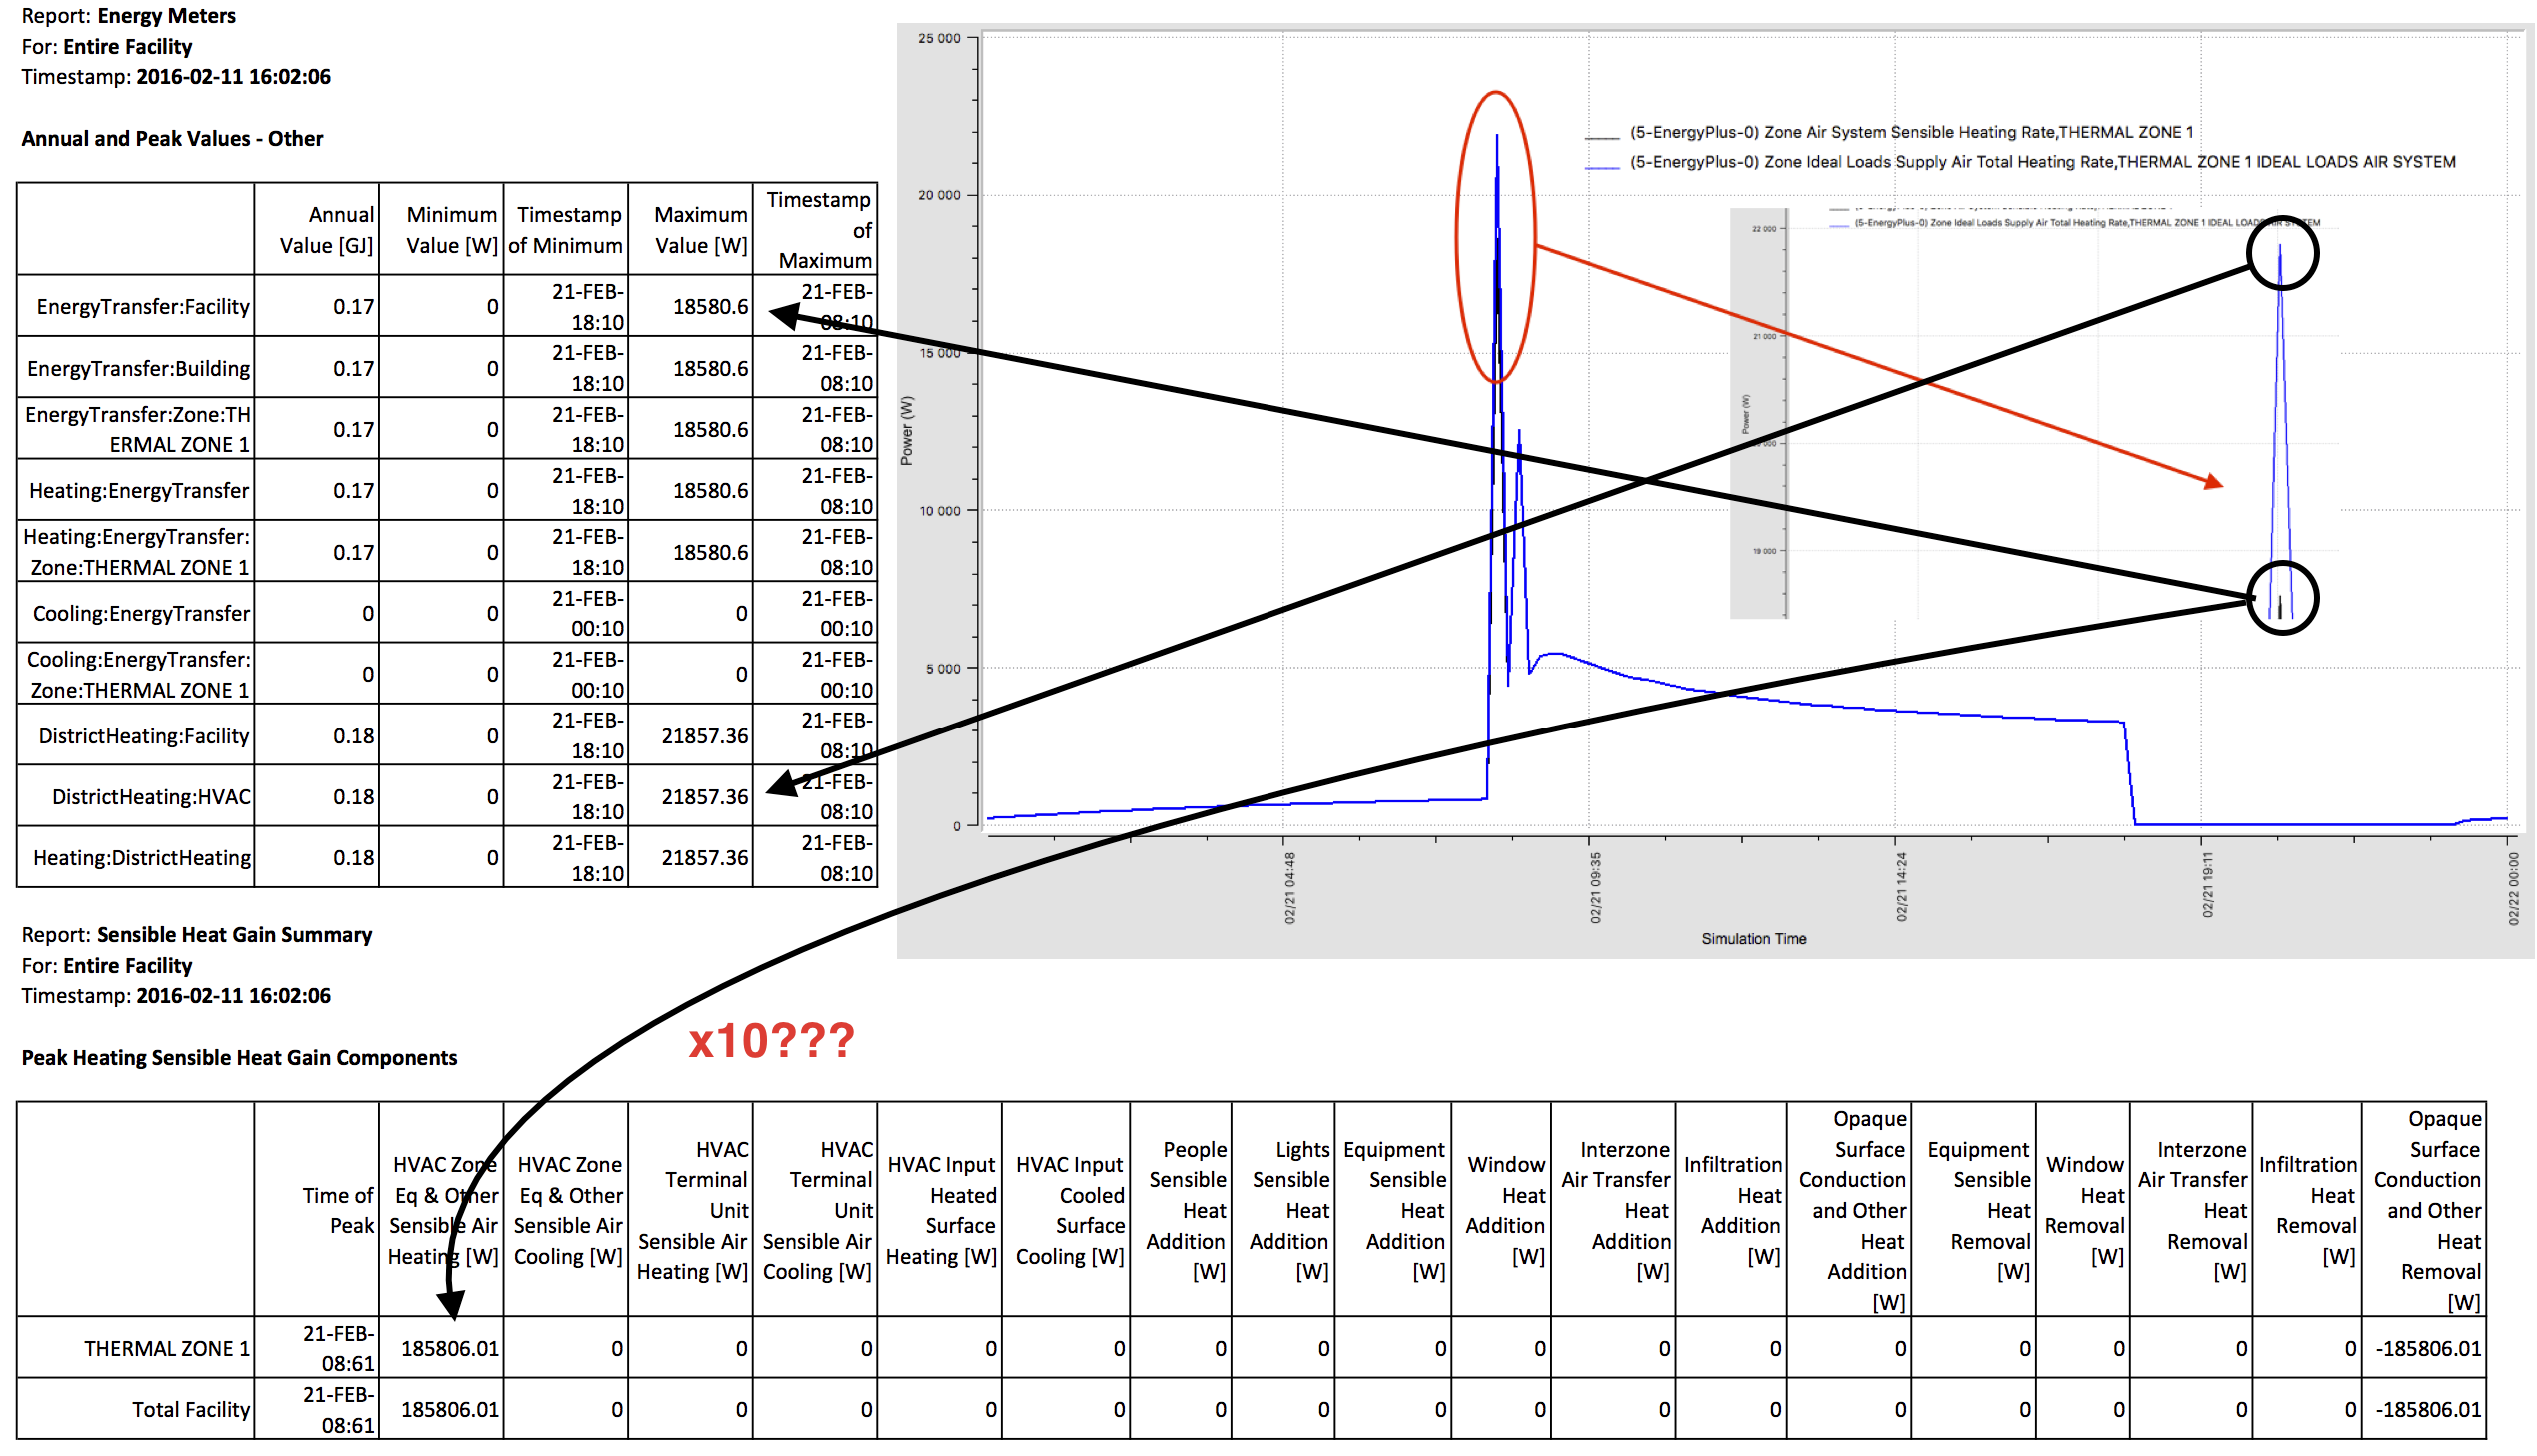
| 2016-02-12 10:06:04 -0500 | answered a question | Constant vs. nighttime-reduced temperature OK, I am progressing :-) Looking at the MTD file, I found that "EnergyTransfer:Facility" is based on "Zone Air System Sensible Heating Rate", while "DistrictHeating: Facility" is based on "Zone Ideal Loads Supply Air Total Heating Rate".
By zooming in on the chart, we see that only the peak is different. The rest of the curve is exactly the same! If I use a constant temperature setpoint, the curves are perfectly superimposed I still can not understand the x10 factor on "Peak Sensible Heat Gain". The model contains a single area, without multiplication factor. All coefficients worth 1.0 This x10 factor also vanishes if I use a constant temperature setpoint... |
| 2016-02-11 09:58:48 -0500 | commented answer | Constant vs. nighttime-reduced temperature Thank you for your help! The place is missing to comment your answer, so I have edited my question. |
| 2016-02-11 09:57:33 -0500 | received badge | ● Editor (source) |
| 2016-02-11 09:52:02 -0500 | received badge | ● Supporter (source) |
| 2016-02-04 10:36:09 -0500 | received badge | ● Student (source) |
| 2016-02-04 08:40:23 -0500 | asked a question | Constant vs. nighttime-reduced temperature Hello, As a new Open Studio user, I conducted a bunch of simulations to understand the impact of different parameters. Among these simulations, a case bothers me. (Sorry, but as a new user I cannot post pictures... I had to insert links to files) The basic version consists of a simple cube (no windows, no internal gains, no infiltration, no ventilation ...). The temperature is set to 22 °C (constant) and I make use of the "ideal air loads system". The results seem consistent (see green values in the file, which are also found in the graph) Results without nighttime-reduced temperature The second version is identical but incorporating a temperature reduction at night and on weekends (16°C instead of 22°C). Of course I understand that some heating-up capacity is necessary, but this does not explain all the results. Results with nighttime-reduced temperature
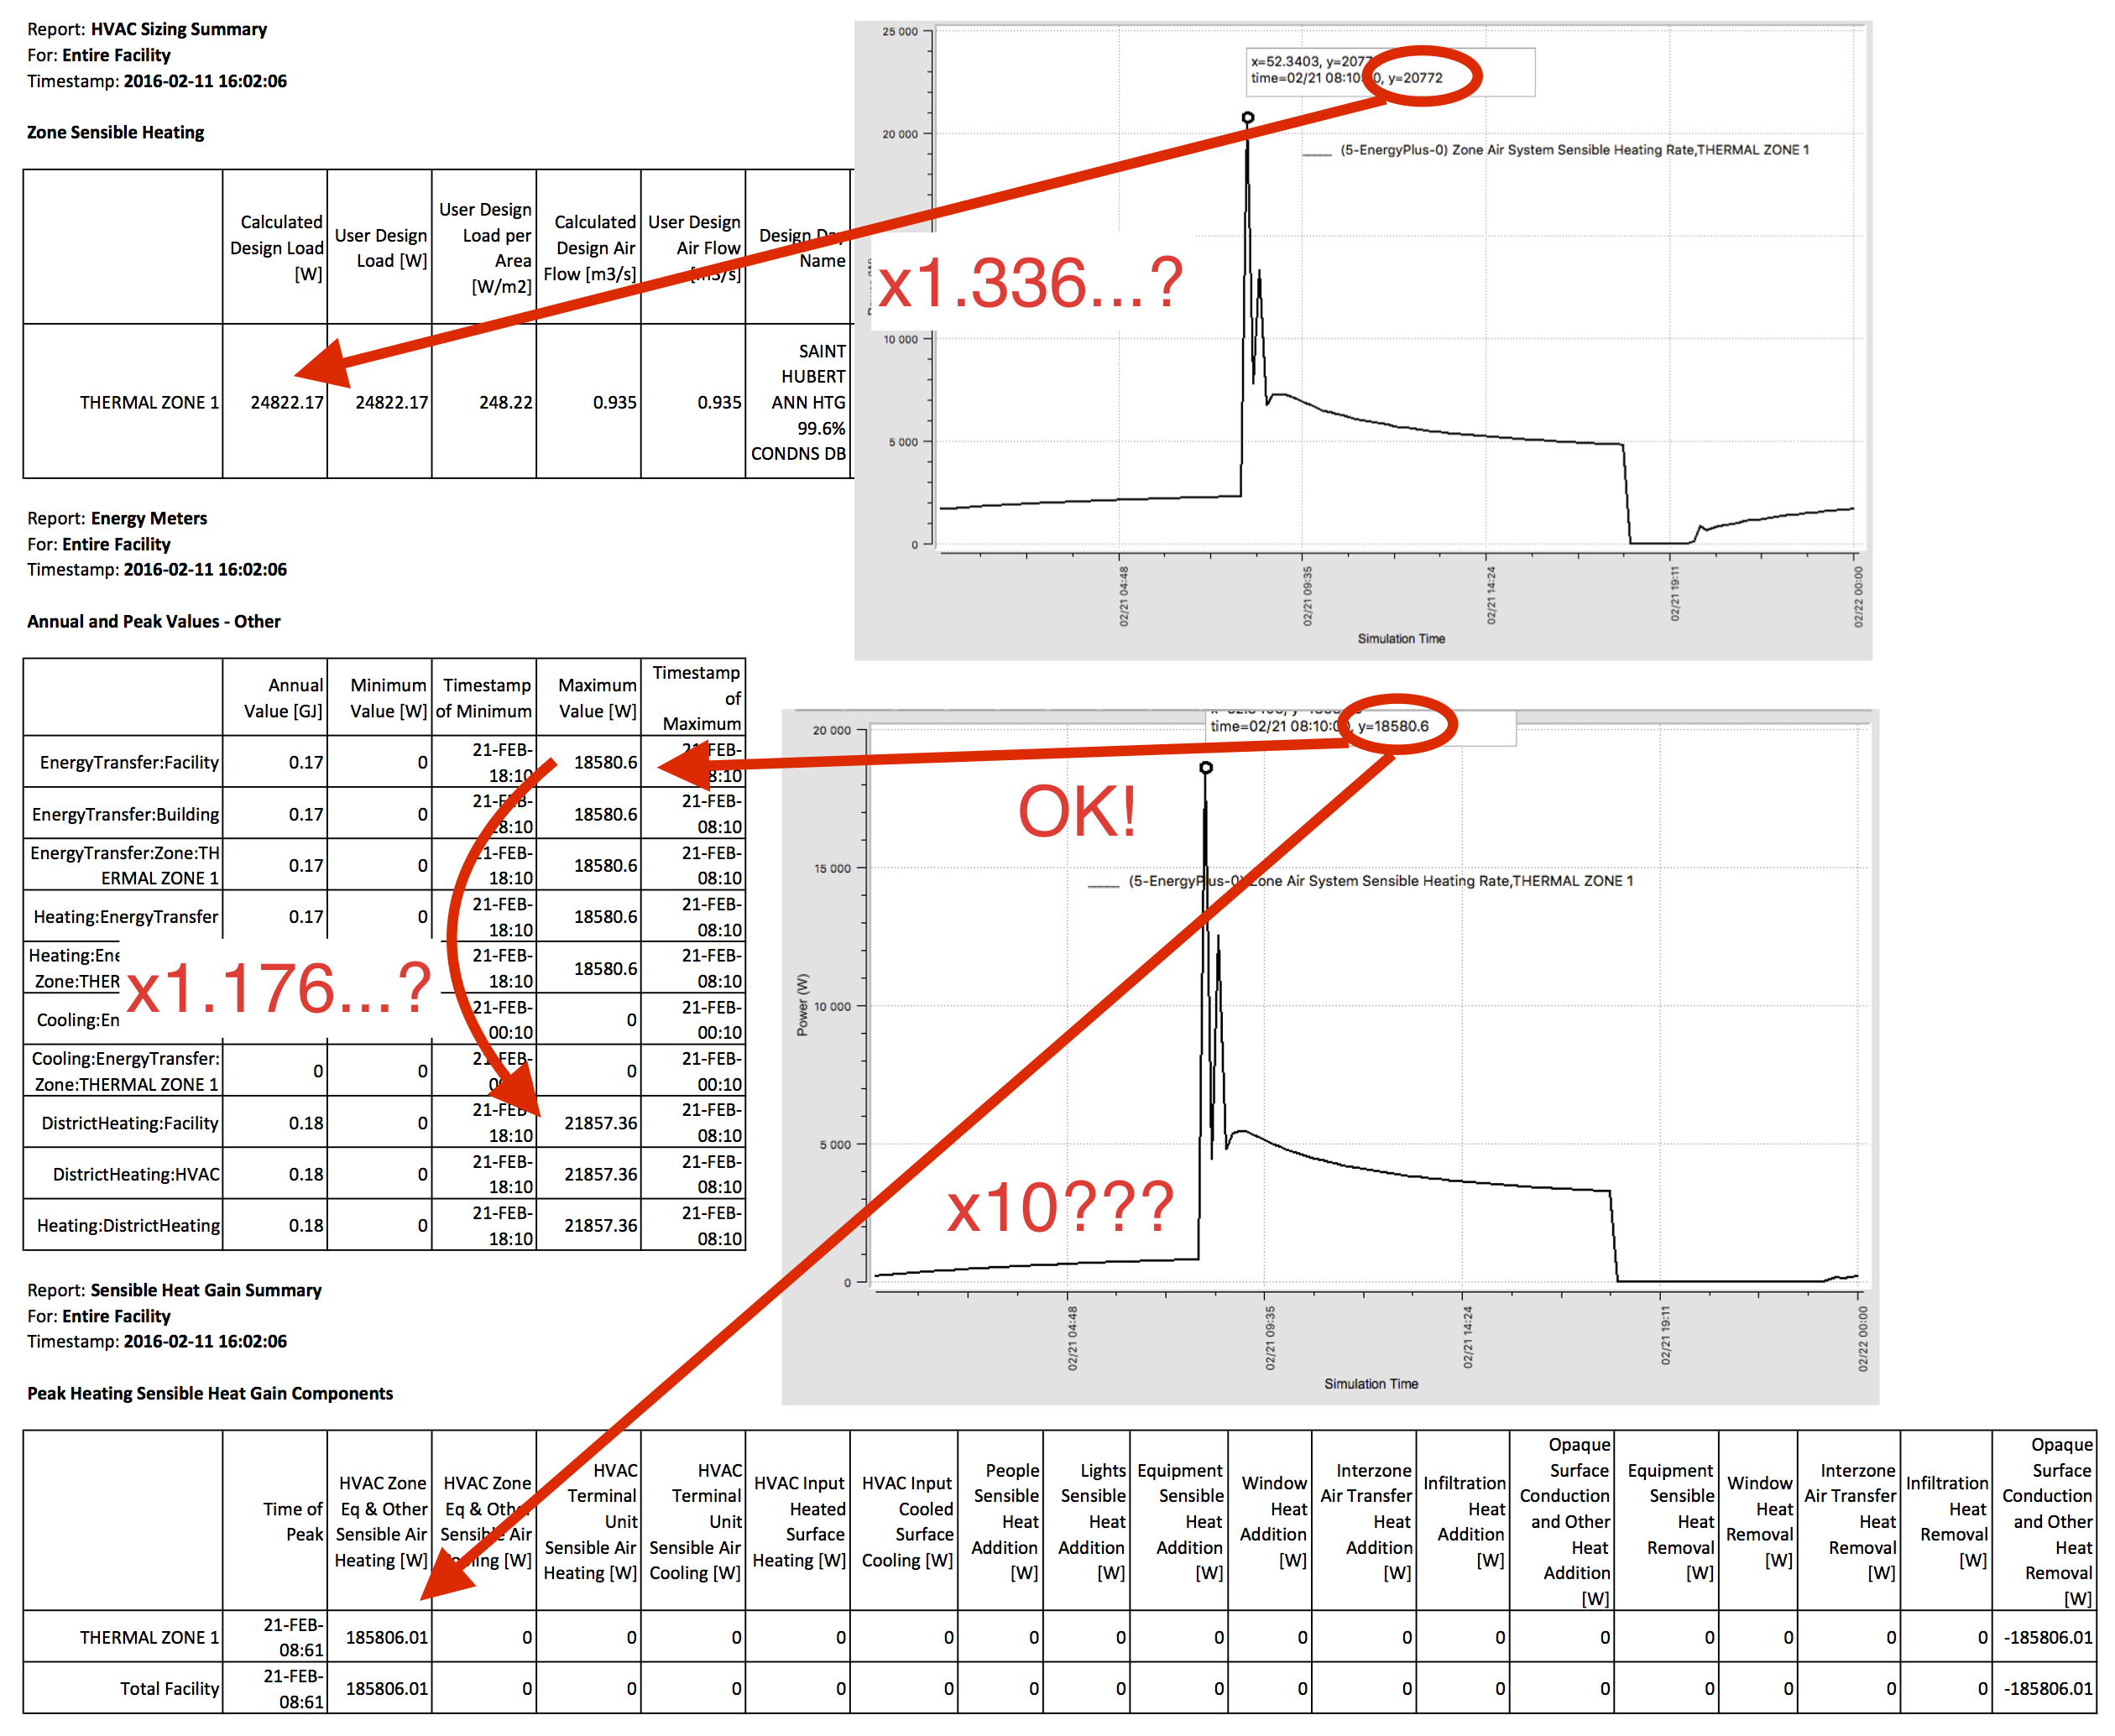
Could you help me? Am I missing something? I understand that this is an "extreme" case, and that in reality the differences will be smaller thanks to internal and solar gains (I tried a real case, and there is an order of magnitude of +/- 2). Without modeling a complete HVAC system, is there a way to get closer to a real heating system (with limited capacity)? Thank you very much for your time. Nicolas EDIT From what I could see, the use of "Timesteps in Averaging Window" only affects the "design load" value in the report. This will certainly help me in other situations, but in fact, my question is not really about sizing (I used constant temperature set point) but the complete runperiod. I could finally find some values by performing the simulation on a day (thank you for the tip), but there are certain factors that I can not explain :
If I use a constant schedule, these three factors are exactly 1 ... Currently, I use "ideal loads air system". I would have to take the time to create a measure which limits the power to the "design load" value calculated in a previous run... Here is a link to the idf file if it can help you : Thanks |