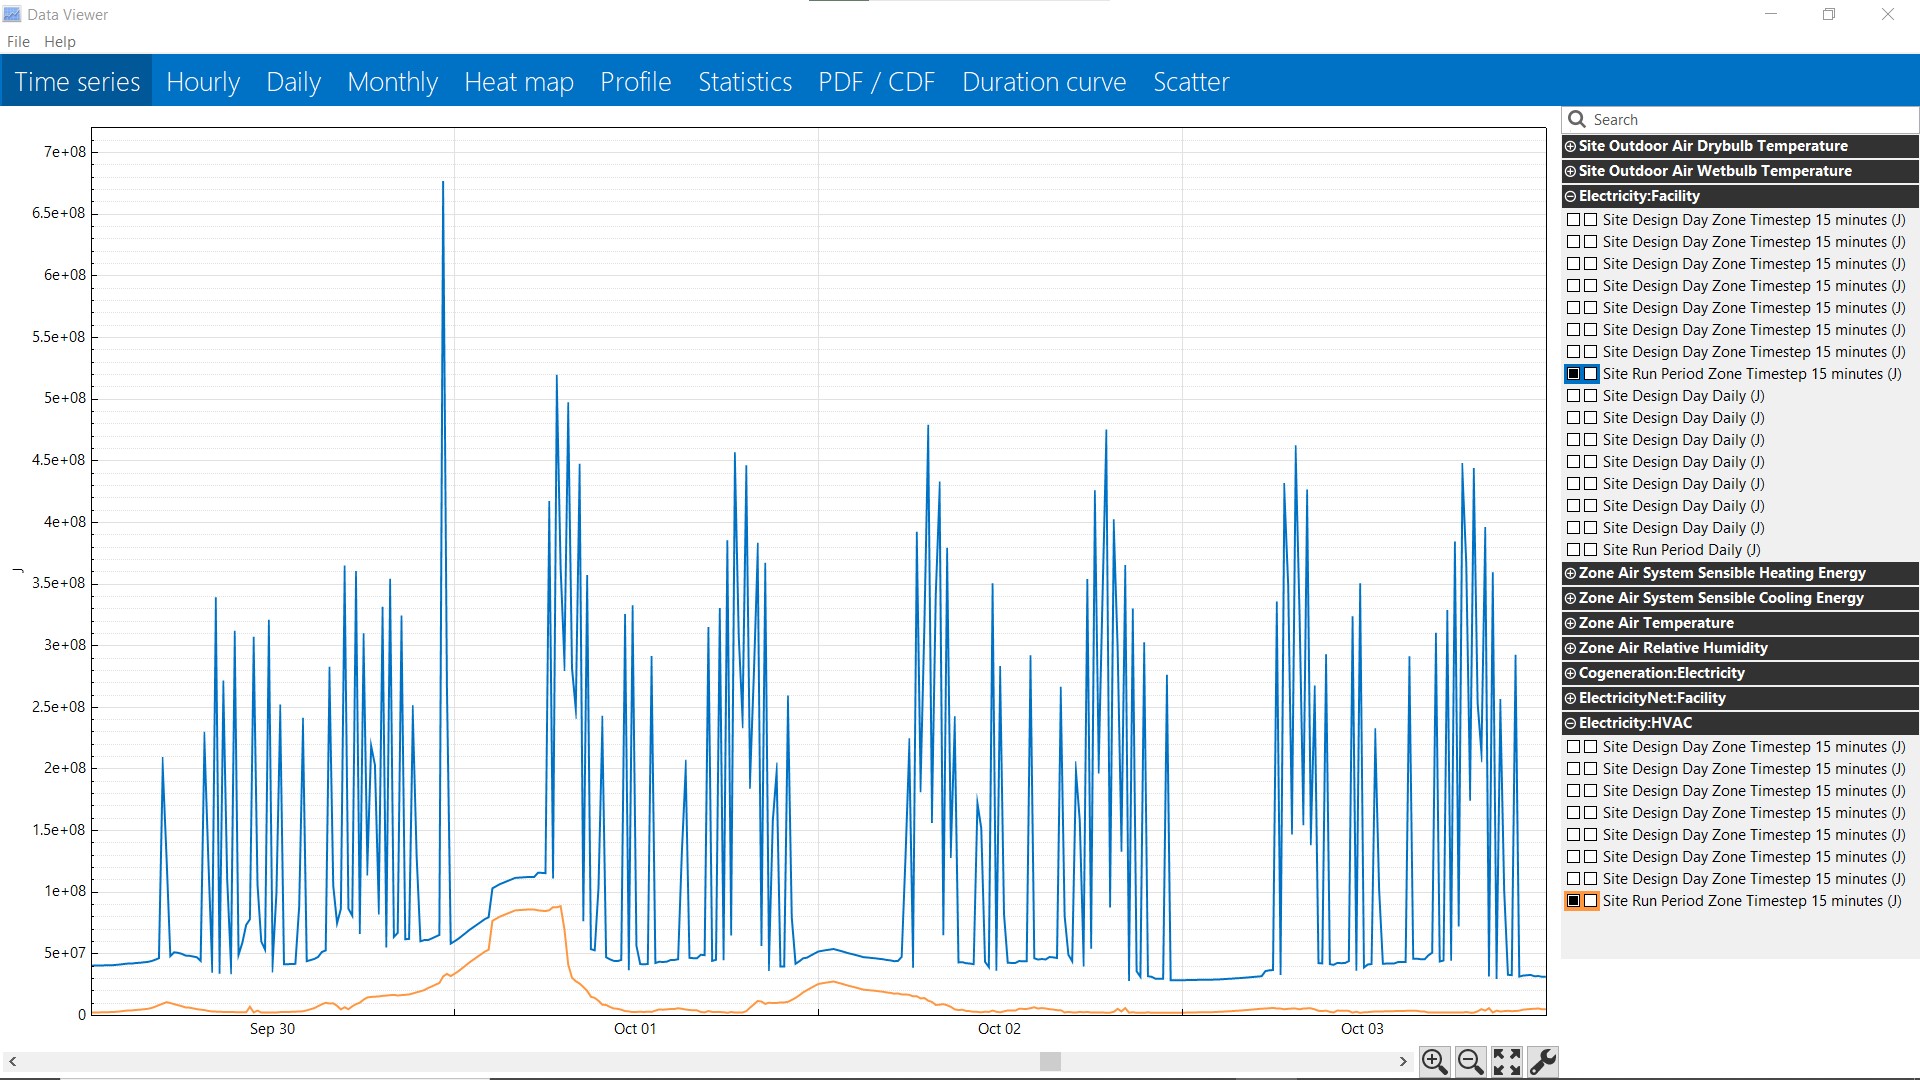
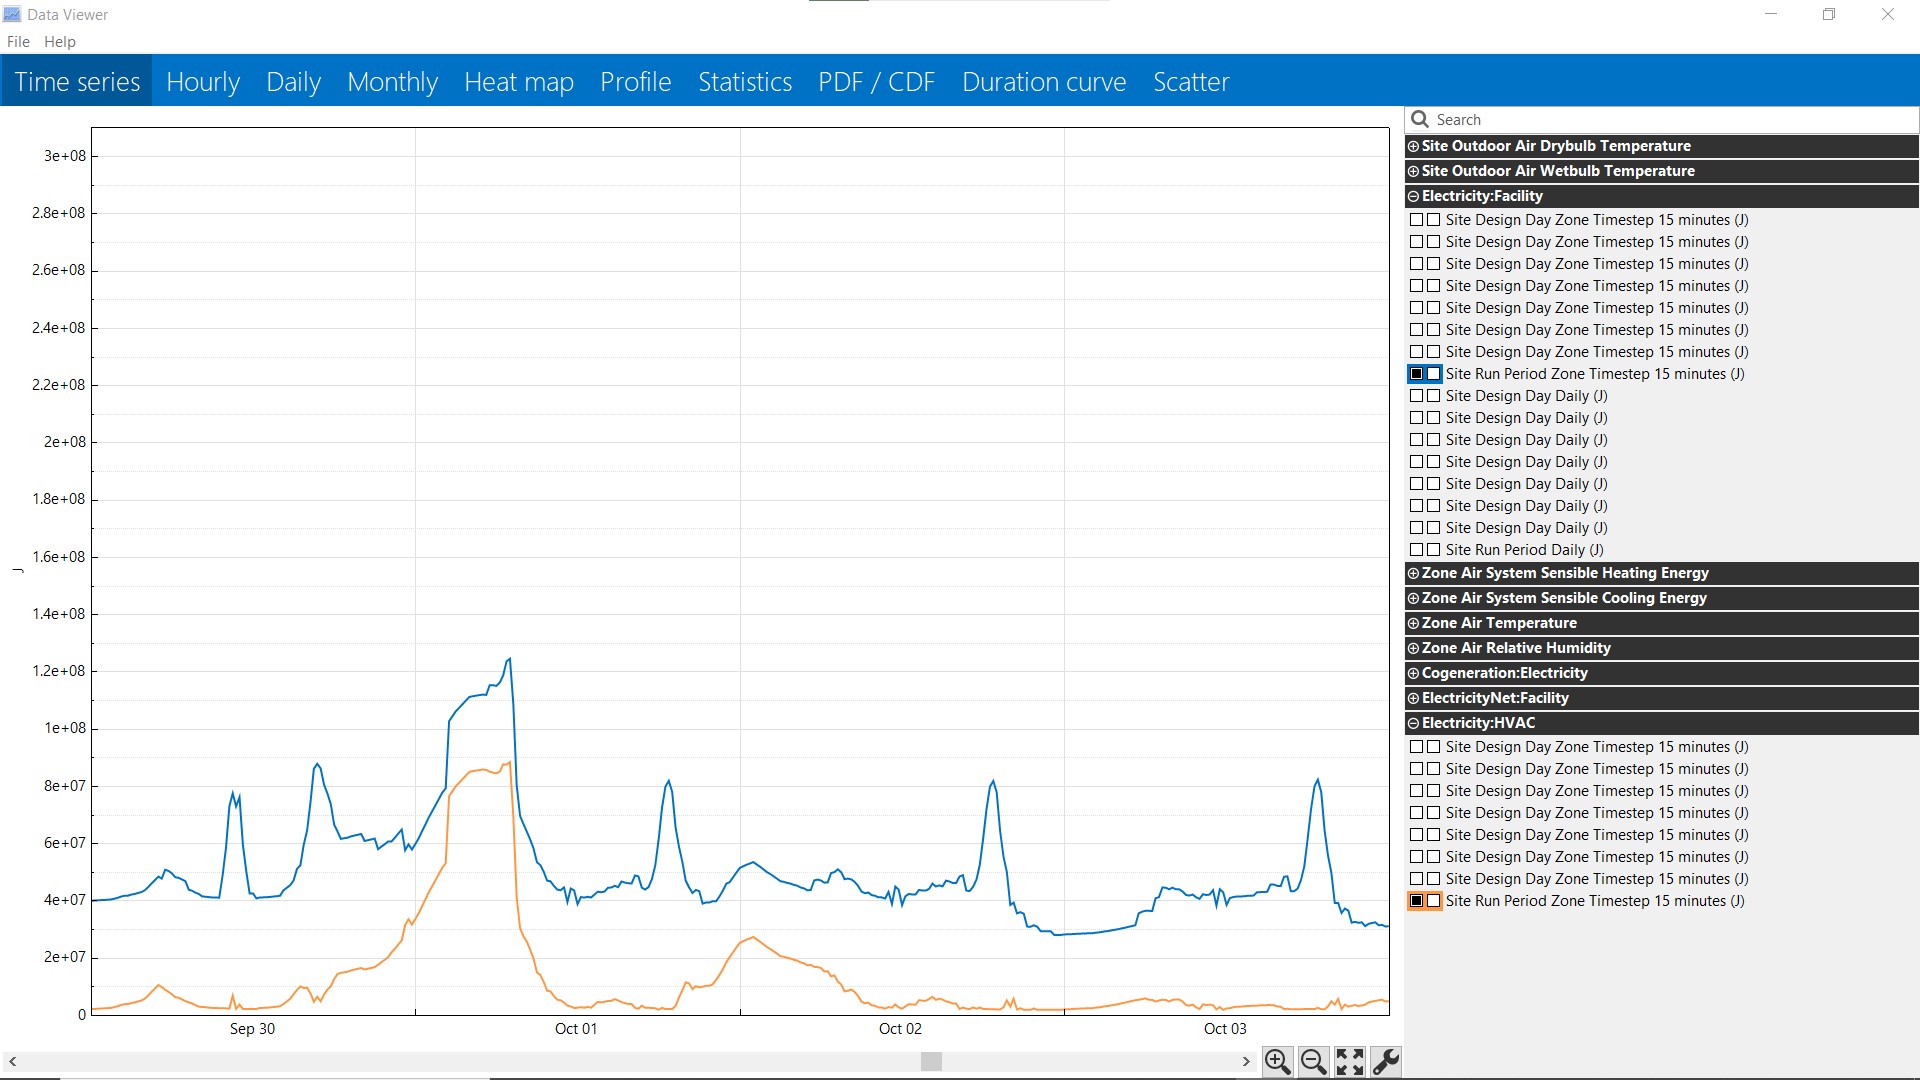
After including an electric hot water system, my model began having excessive electricity peaking loads, as seen in the graph below. NOTE: The peaks in this graph occur throughout the entire year, I zoomed so that the peaks could be appreciated.

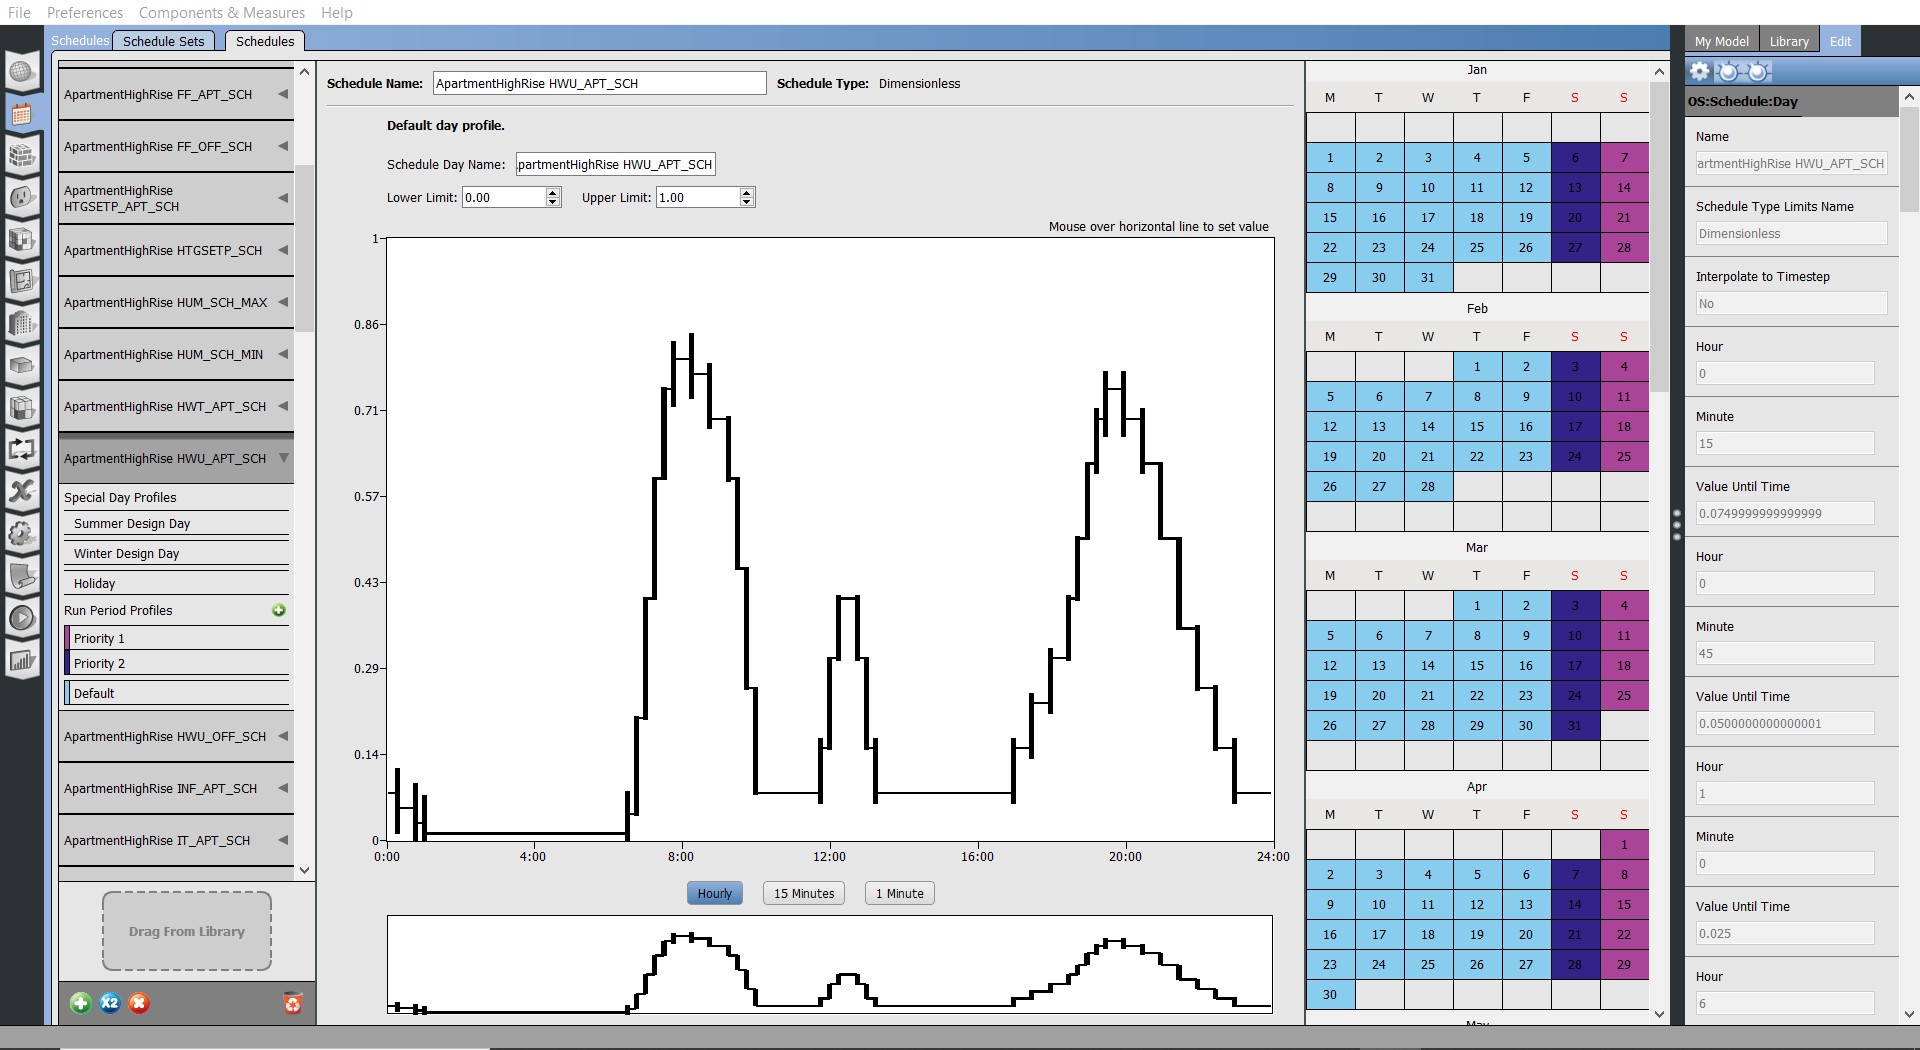
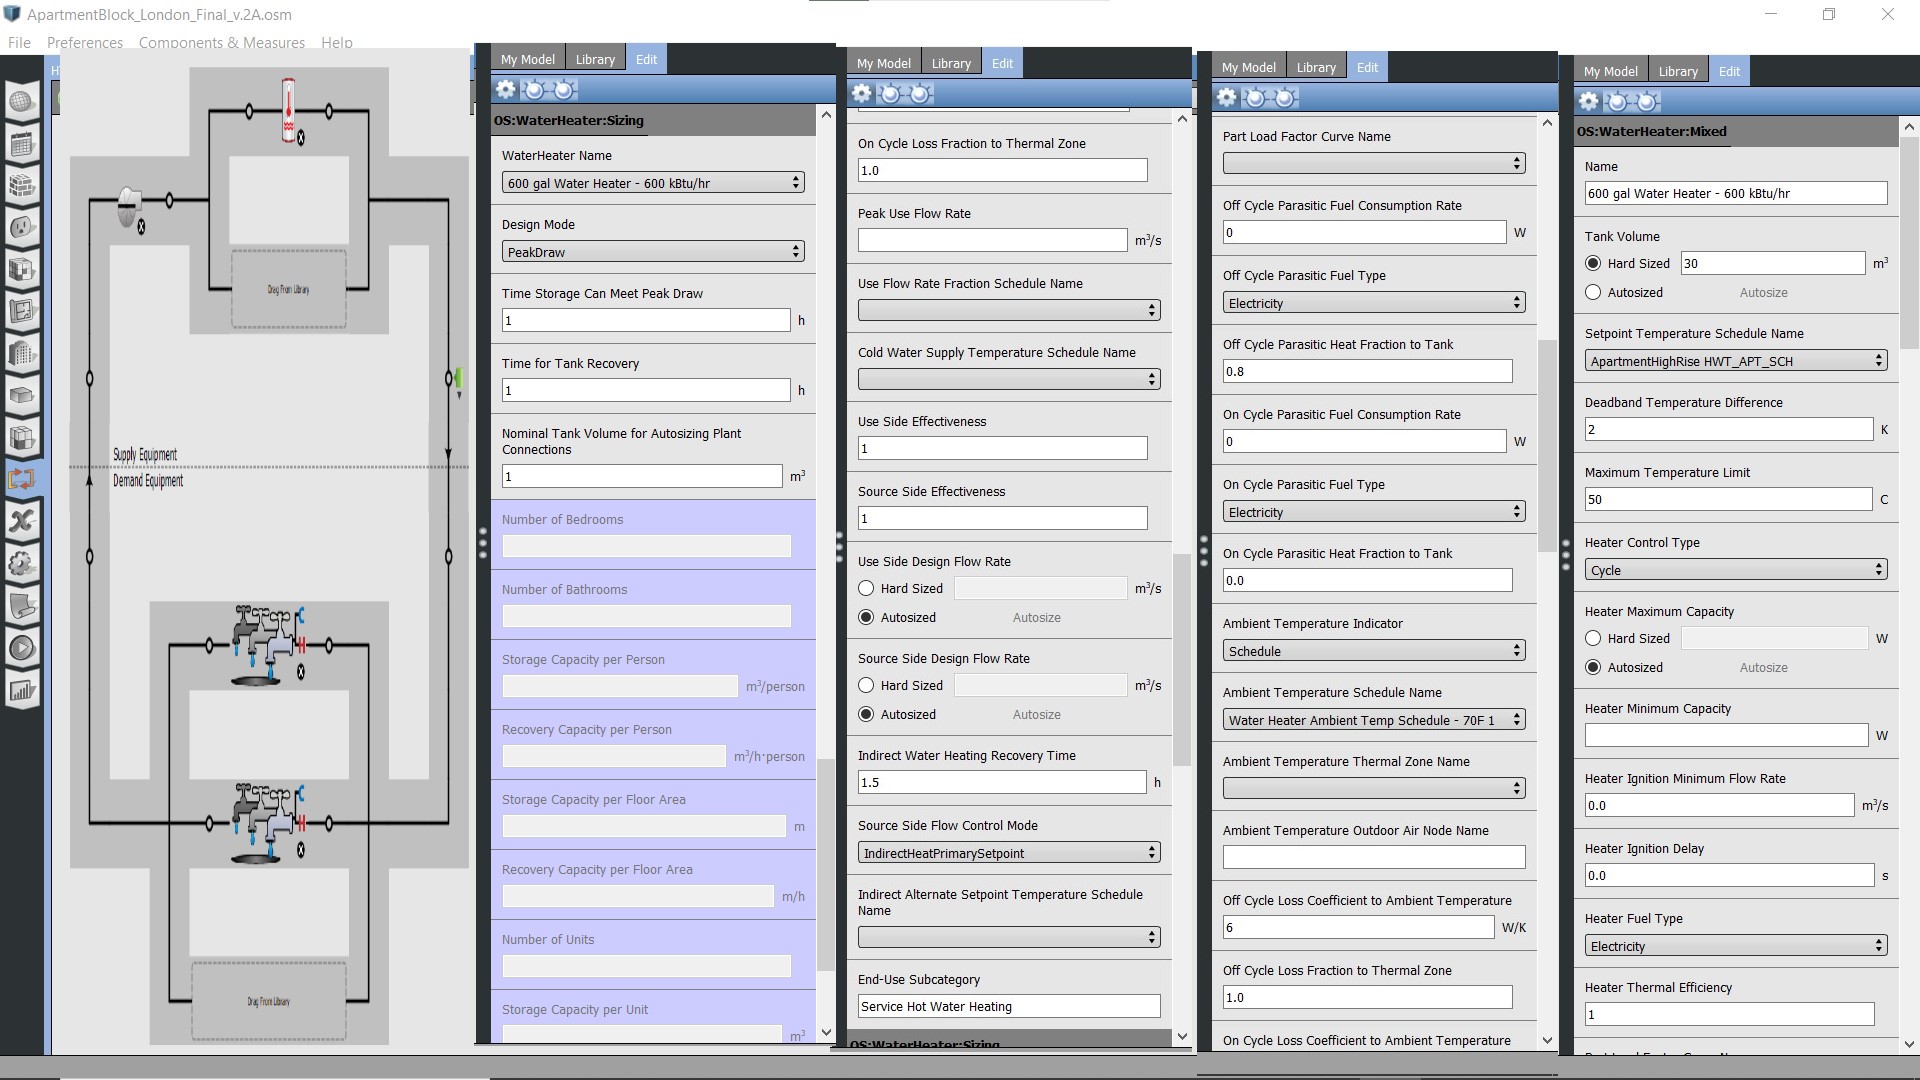
I have designed a very simplified hot water loop for a 15-story residential building, containing apartments and offices. It contains (in clockwise order) an electric water heater, a setpoint manager, two water use connections, and a constant-speed pump. The water demand for all apartments (112 with 3.25 people per apartment) and all offices (8 with 10 people per office) is represented by each water use connection. Using the ASHRAE Modified Hunter Curve - Flow Chart and Fixture Units, I have selected a peak flow rate of 0.004227 m3/s (for all 112 apartments) and 0.000631 m3/s (for all 8 offices). The schedules I have used for hot water are trimodal (morning, afternoon, and evening peaks) with no mode exceeding 0.8 of the peak loads stated above.
This post (https://unmethours.com/question/18901/openstudio-service-water-heating-load/) suggests that inappropriate heater sizing can lead to extreme peak loads. I tried doing the same thing they tried at the start, i.e. decrease peak flow rate and schedules, but still no major change. I also tried implementing the solution to the post (i.e. over-size the heater), but it actually caused peaking electricity demand for hot water to skyrocket (from 300kW to 1000kW). Why is ths happening? And, how can it be solved?
Many thanks!


