Question-and-Answer Resource for the Building Energy Modeling Community
Get started with the Help page
Ask Your Question

Revision history [back]

click to hide/show revision 1
initial version

How does ResStock calculate conditional probability distributions in housing_characteristics tsv files?

For reference I am using ResStock v2.2.4 and OpenStudio/PAT v2.9.0, with EnergyPlus v9.2.

I am trying to model a particular community in Georgia. I have 3 different AMY EPW files that I have purchased from Whitebox Technologies: http://weather.whiteboxtechnologies.com/: a 2008 EPW file for Blairsville GA, a 2008 EPW file for Andrews NC, and a 2008 EPW file for Franklin NC.

In order for PAT to recognize these EPW files, I have had to rename the EPW files as follows before zipping them and uploading them to dropbox to obtain a direct download link for input into PAT's server script section, depending on what Location I select out in Location.tsv within the housing_characteristics directory. The options I have determined to be candidates in Location.tsv are Asheville AP (NC), Athens AP (GA), and Chattanooga AP (TN), based on their proximity to the desired location I am modelling.

Location TSV configurations for Asheville AP and Chattanooga AP are presented below. TSV configurations are mutually exclusive, as in I would only run one PAT simulation per configuration at a time. I suspect an error would be thrown if there were multiple "1s" in Location TSV file.

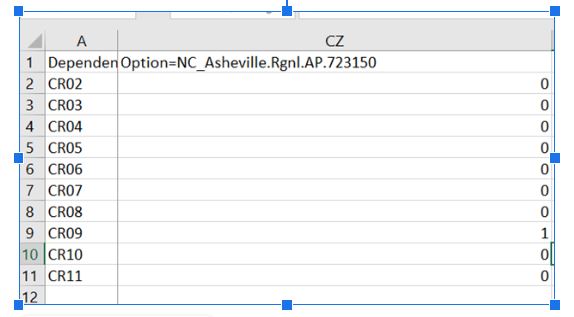
C:\fakepath\Asheville Location TSV configuration.JPG

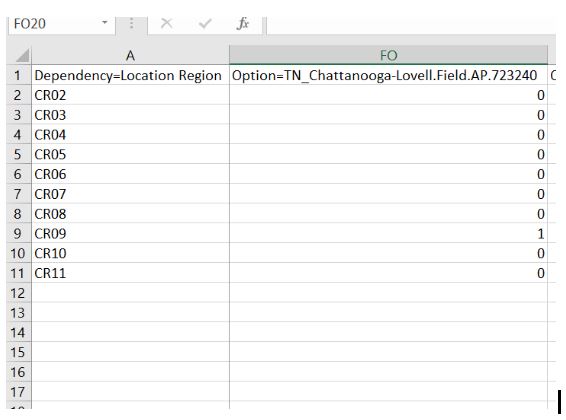
C:\fakepath\Chattanooga Location TSV configuration.JPG

In order for PAT to recongize the EPW files, their names were as follows depending on what Location.TSV config I was running with.

Asheville Location TSV configuration --> 0996216_US_NC_Buncombe_37021_0-20000-0-72315_35.45_-82.54_NSRDB_2.0.1_AMY EPW file name.

Chattanooga Location TSV configruation --> 0939546_US_TN_Hamilton_47065_0-20000-0-72324_35.05_-85.22_NSRDB_2.0.1_AMY EPW file name.

Athens Location TSV configuration --> 0979938_US_GA_Clarke_13059_0-20000-0-72311_33.97_-83.34_NSRDB_2.0.1_AMY EPW file name.

Thats the background. Here's the real issue.

I noticed that if I ran two simulations, all else held equal INCLUDING APPLY UPGRADE MEASURE AND THE EPW FILE USED, I would get different results depending on what configuration I was using in Location TSV. I did some digging into specific files in housing_characteristics, and I noticed that Geometry Foundation Type.tsv and Heating Fuel.tsv had Dependency=Location, meaning that their conditional probability distributions are conditional on whatever value/configuration is in Location.tsv. When I changed these conditional probability distributions to possess the same values, I would get the same results.csv output.

For example, see:

C:\fakepath\Geometry Foundation Type change.JPG

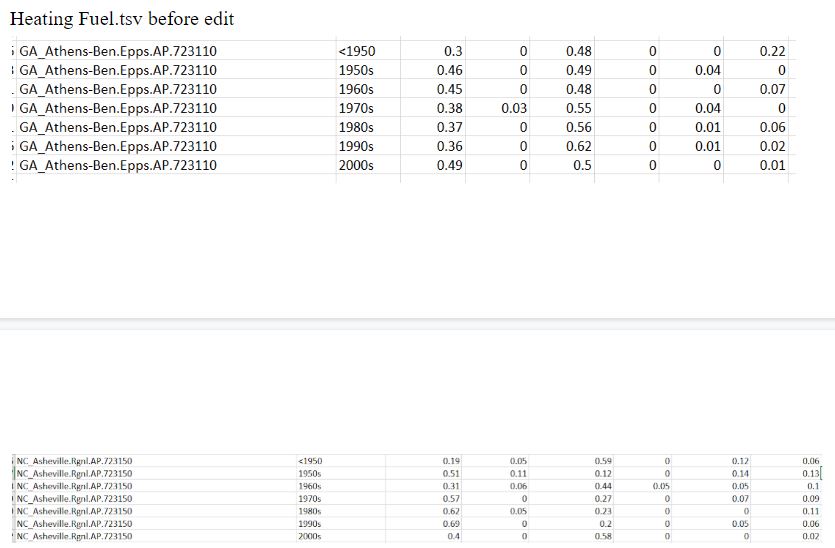
C:\fakepath\Heating Fuel tsv before edit.JPG

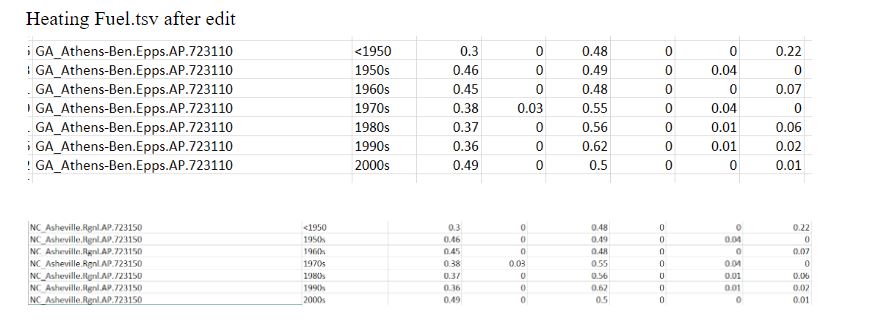
C:\fakepath\Heating Fuel tsv after edit.JPG

How does ResStock calculate the probability distributions seen above for Heating Fuel and Foundation Type? I would like to get a probability distribution that is representative of my area. I was able to insert my own custom distribution for vintage.tsv: see below. This distribution was calculated using ArcGIS and survey data. I would like to be able to create something similar for Geometry Foundation Type and Heating Fuel tsv sections.

C:\fakepath\Vintage TSV custom distribution.JPG

How does ResStock calculate conditional probability distributions in housing_characteristics tsv files?

For reference I am using ResStock v2.2.4 and OpenStudio/PAT v2.9.0, with EnergyPlus v9.2.

I am trying to model a particular community in Georgia. I have 3 different AMY EPW files that I have purchased from Whitebox Technologies: http://weather.whiteboxtechnologies.com/: a 2008 EPW file for Blairsville GA, a 2008 EPW file for Andrews NC, and a 2008 EPW file for Franklin NC.

In order for PAT to recognize these EPW files, I have had to rename the EPW files as follows before zipping them and uploading them to dropbox to obtain a direct download link for input into PAT's server script section, depending on what Location I select out in Location.tsv within the housing_characteristics directory. The options I have determined to be candidates in Location.tsv are Asheville AP (NC), Athens AP (GA), and Chattanooga AP (TN), based on their proximity to the desired location I am modelling.

Location TSV configurations for Asheville AP and Chattanooga AP are presented below. TSV configurations are mutually exclusive, as in I would only run one PAT simulation per configuration at a time. I suspect an error would be thrown if there were multiple "1s" in Location TSV file.

C:\fakepath\Asheville Location TSV configuration.JPG

C:\fakepath\Chattanooga Location TSV configuration.JPGAsheville Location TSV config

Chattanooga Location TSV config

In order for PAT to recongize the EPW files, their names were as follows depending on what Location.TSV config I was running with.

Asheville Location TSV configuration --> 0996216_US_NC_Buncombe_37021_0-20000-0-72315_35.45_-82.54_NSRDB_2.0.1_AMY EPW file name.

Chattanooga Location TSV configruation --> 0939546_US_TN_Hamilton_47065_0-20000-0-72324_35.05_-85.22_NSRDB_2.0.1_AMY EPW file name.

Athens Location TSV configuration --> 0979938_US_GA_Clarke_13059_0-20000-0-72311_33.97_-83.34_NSRDB_2.0.1_AMY EPW file name.

Thats the background. Here's the real issue.

I noticed that if I ran two simulations, all else held equal INCLUDING APPLY UPGRADE MEASURE AND THE EPW FILE USED, I would get different results depending on what configuration I was using in Location TSV. I did some digging into specific files in housing_characteristics, and I noticed that Geometry Foundation Type.tsv and Heating Fuel.tsv had Dependency=Location, meaning that their conditional probability distributions are conditional on whatever value/configuration is in Location.tsv. When I changed these conditional probability distributions to possess the same values, I would get the same results.csv output.

For example, see:

C:\fakepath\Geometry Foundation Type change.JPG

C:\fakepath\Heating Fuel tsv before edit.JPG

C:\fakepath\Heating Fuel tsv after edit.JPGGeometry Foundation Type TSV change

Heating Fuel TSV before edit

Heating Fuel TSV after edit

How does ResStock calculate the probability distributions seen above for Heating Fuel and Foundation Type? I would like to get a probability distribution that is representative of my area. I was able to insert my own custom distribution for vintage.tsv: see below. This distribution was calculated using ArcGIS and survey data. I would like to be able to create something similar for Geometry Foundation Type and Heating Fuel tsv sections.
C:\fakepath\Vintage TSV custom distribution.JPGVintage TSV custom distribution

How does ResStock calculate conditional probability distributions in housing_characteristics tsv files?

For reference I am using ResStock v2.2.4 and OpenStudio/PAT v2.9.0, with EnergyPlus v9.2.

I am trying to model a particular community in Georgia. I have 3 different AMY EPW files that I have purchased from Whitebox Technologies: http://weather.whiteboxtechnologies.com/: a 2008 EPW file for Blairsville GA, a 2008 EPW file for Andrews NC, and a 2008 EPW file for Franklin NC.

In order for PAT to recognize these EPW files, I have had to rename the EPW files as follows before zipping them and uploading them to dropbox to obtain a direct download link for input into PAT's server script section, depending on what Location I select out in Location.tsv within the housing_characteristics directory. The options I have determined to be candidates in Location.tsv are Asheville AP (NC), Athens AP (GA), and Chattanooga AP (TN), based on their proximity to the desired location I am modelling.

Location TSV configurations for Asheville AP and Chattanooga AP are presented below. TSV configurations are mutually exclusive, as in I would only run one PAT simulation per configuration at a time. I suspect an error would be thrown if there were multiple "1s" in Location TSV file.

Asheville Location TSV config

Chattanooga Location TSV config

In order for PAT to recongize the EPW files, their names were as follows depending on what Location.TSV config I was running with.

Asheville Location TSV configuration --> 0996216_US_NC_Buncombe_37021_0-20000-0-72315_35.45_-82.54_NSRDB_2.0.1_AMY EPW file name.

Chattanooga Location TSV configruation --> 0939546_US_TN_Hamilton_47065_0-20000-0-72324_35.05_-85.22_NSRDB_2.0.1_AMY EPW file name.

Athens Location TSV configuration --> 0979938_US_GA_Clarke_13059_0-20000-0-72311_33.97_-83.34_NSRDB_2.0.1_AMY EPW file name.

Thats the background. Here's the real issue.

I noticed that if I ran two simulations, all else held equal INCLUDING APPLY UPGRADE MEASURE AND THE EPW FILE USED, I would get different results depending on what configuration I was using in Location TSV. I did some digging into specific files in housing_characteristics, and I noticed that Geometry Foundation Type.tsv and Heating Fuel.tsv had Dependency=Location, meaning that their conditional probability distributions are conditional on whatever value/configuration is in Location.tsv. When I changed these conditional probability distributions to possess the same values, I would get the same results.csv output.

For example, see:

Geometry Foundation Type TSV change

Heating Fuel TSV before edit

Heating Fuel TSV after edit

How does ResStock calculate the probability distributions seen above for Heating Fuel and Foundation Type? I would like to get a probability distribution that is representative of my area. I was able to insert my own custom distribution for vintage.tsv: see below. This distribution was calculated using ArcGIS and survey data. I would like to be able to create something similar for Geometry Foundation Type and Heating Fuel tsv sections.
Vintage TSV custom distribution

How does ResStock calculate conditional probability distributions in housing_characteristics tsv files?

For reference I am using ResStock v2.2.4 and OpenStudio/PAT v2.9.0, with EnergyPlus v9.2.

I am trying to model a particular community in Georgia. I have 3 different AMY EPW files that I have purchased from Whitebox Technologies: http://weather.whiteboxtechnologies.com/: files; a 2008 EPW file for Blairsville GA, a 2008 EPW file for Andrews NC, and a 2008 EPW file for Franklin NC.

In order for PAT to recognize these EPW files, I have had to rename the EPW files as follows before zipping them and uploading them to dropbox to obtain a direct download link for input into PAT's server script section, depending on what Location I select out in Location.tsv within the housing_characteristics directory. The options I have determined to be candidates in Location.tsv in housing_characteristics directory are Asheville AP (NC), Athens AP (GA), and Chattanooga AP (TN), based on their proximity to the desired location I am modelling.

Location TSV configurations for Asheville AP and Chattanooga AP are presented below. TSV configurations are mutually exclusive, as in I would only run one PAT simulation per configuration at a time. I suspect an error would be thrown if there were multiple "1s" in Location TSV file.

Asheville Location TSV config

Chattanooga Location TSV config

In order for PAT to recongize recognize the EPW files, their names they were as follows depending on what Location.TSV config I was running with.renamed before being zipped and uploaded to dropbox to create direct download links.

Asheville Location TSV configuration --> 0996216_US_NC_Buncombe_37021_0-20000-0-72315_35.45_-82.54_NSRDB_2.0.1_AMY EPW file name.

Chattanooga Location TSV configruation --> 0939546_US_TN_Hamilton_47065_0-20000-0-72324_35.05_-85.22_NSRDB_2.0.1_AMY EPW file name.

Athens Location TSV configuration --> 0979938_US_GA_Clarke_13059_0-20000-0-72311_33.97_-83.34_NSRDB_2.0.1_AMY EPW file name.

Thats the background. Here's the real issue.

I noticed that if If I ran two simulations, all else held equal INCLUDING APPLY UPGRADE MEASURE AND THE EPW FILE USED, equal, I would get different results depending on what configuration I was using in Location TSV. I did some digging into specific files in housing_characteristics, and I noticed that Geometry Foundation Type.tsv and Heating Fuel.tsv had Dependency=Location, meaning that their conditional probability distributions are conditional on whatever value/configuration is in Location.tsv. When I changed these conditional probability distributions to possess the same values, I would get the same results.csv output.

For example, see:

Geometry Foundation Type TSV change

Heating Fuel TSV before edit

Heating Fuel TSV after edit

How does ResStock calculate the probability distributions seen above for Heating Fuel and Foundation Type? I would like to get a probability distribution that is representative of my area. I was able to insert my own custom distribution for vintage.tsv: see below. This distribution was calculated using ArcGIS and survey data. I would like to be able to create something similar for Geometry Foundation Type and Heating Fuel tsv sections.

Vintage TSV custom distributionarea.