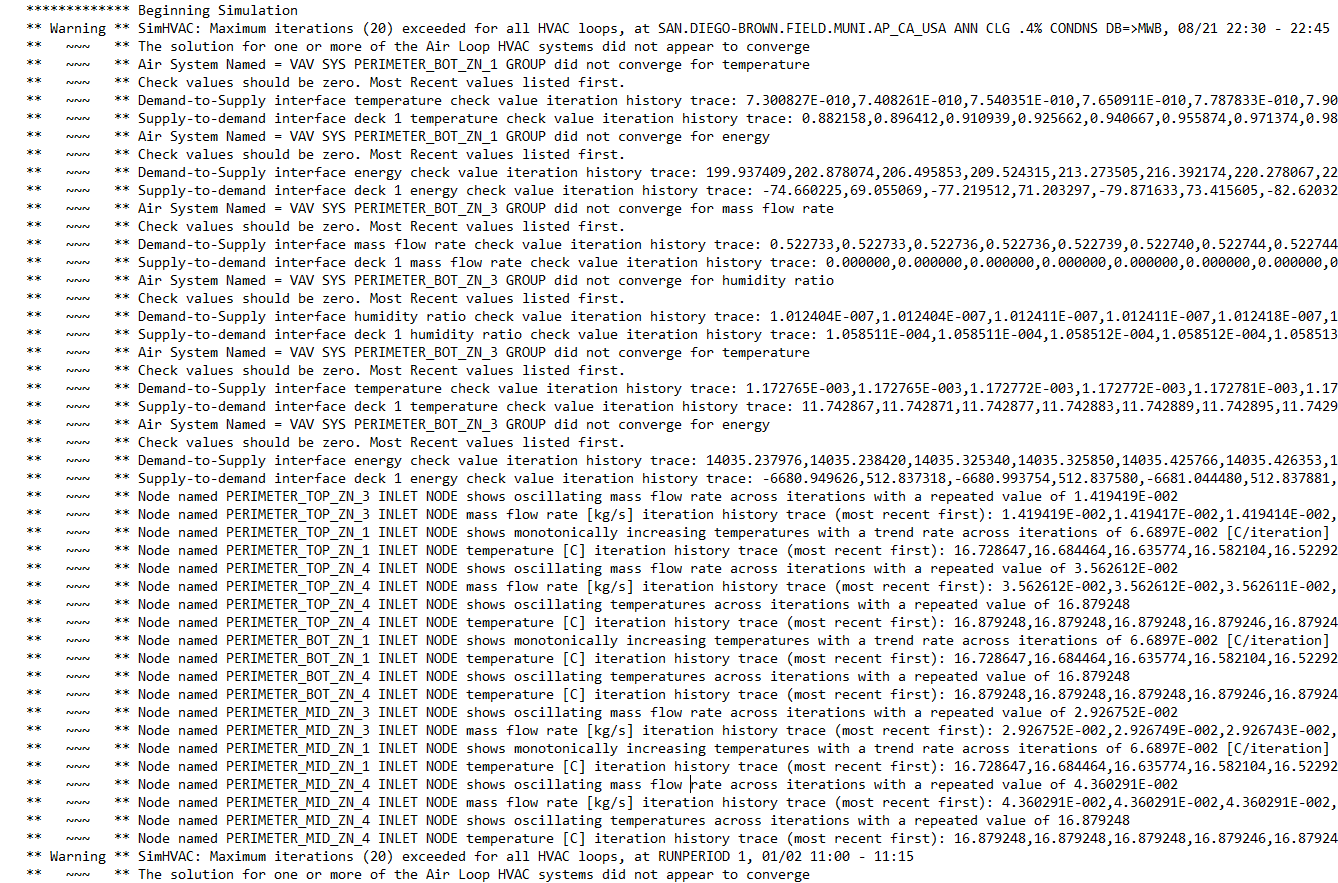
I have a VAV system which is creating a bunch of warnings about convergence, but other unmethours posts indicate that these warnings may not be a problem. For instance, if the warning only occurs once a day when the HVAC system first turns on, then I think I can safely ignore the warnings. However, I don't know of an easy way to plot the times when all those warnings occur. Plots of Output:Variables and Output:Meters are extremely useful for diagnosing problems, and practical because everything is outputted to a CSV file, which is why I'm hoping to do the same with these SimHVAC warnings.
How do I output the times these SimHVAC warnings occur, and in general when warnings, severe errors, and fatal errors occur in a practical format like a CSV file?


