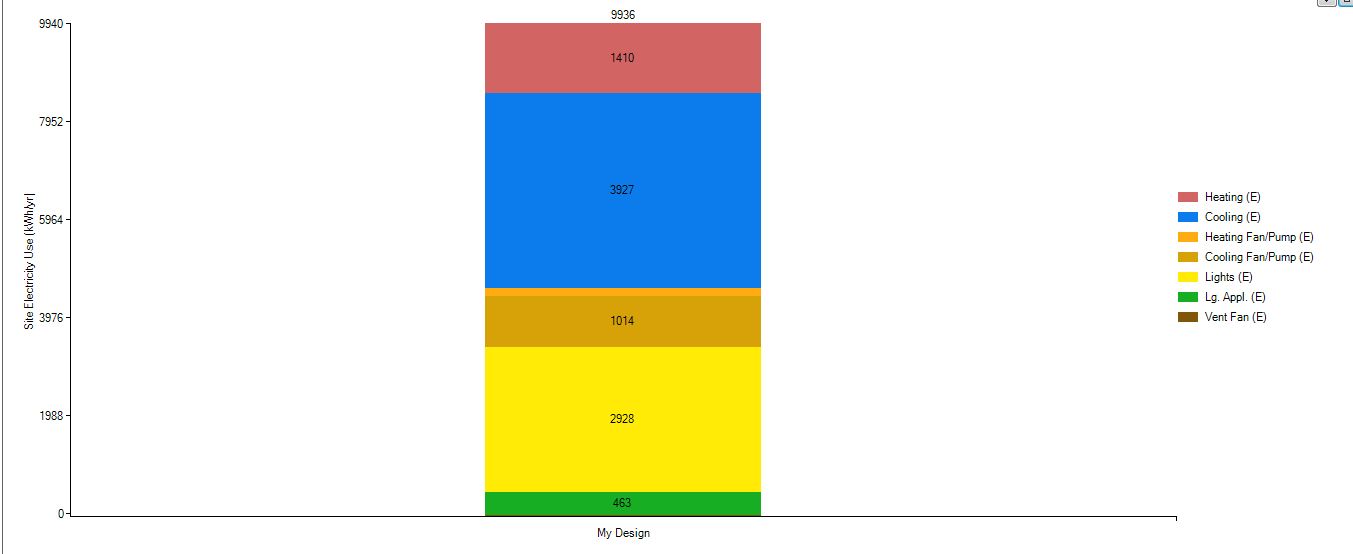
I want to analyze the results obtained by data viewer but I saw that there is a contradiction between the end use graph and the results of dview, normally if I do the sum of annual consumption of heating and cooling, I must fell on the total consumption that is in end use graph but in dview the monthly consumption is very small as shows the figures below


 (/upfiles/15335549729494664.jpg)

