
TLDR: The sample EnergyPlus condensing boiler curve doesn't look like a typical condensing boiler curve. Is there something wrong with it?
Samples for boiler performance curves are available in boilers.idf.
The first curve is for a "Gas-fired condensing boiler...Use curve below for a condensing boiler having a nominal thermal efficiency of 0.89" and consists of:
  Curve:Biquadratic,
    CondensingBoilerEff,     !- Name
    1.124970374,             !- Coefficient1 Constant
    0.014963852,             !- Coefficient2 x
    -0.02599835,             !- Coefficient3 x**2
    0.0,                     !- Coefficient4 y
    -1.40464E-6,             !- Coefficient5 y**2
    -0.00153624,             !- Coefficient6 x*y
    0.1,                     !- Minimum Value of x
    1.0,                     !- Maximum Value of x
    30.0,                    !- Minimum Value of y
    85.0;                    !- Maximum Value of y
In order to interpret this I looked in the EnergyPlus Input/Output Reference, section Boiler:HotWater, subsection Field: Normalized Boiler Efficiency Curve Name which indicates:
For all curve types PLR is always the x independent variable. When using 2 independent variables, the boiler outlet water temperature (Toutlet) is always the y independent variable.
Based on that I plotted several curves, expecting to see a more-or-less typical curve for a condensing boiler which would have an inflection around ~120 F. Like this one:
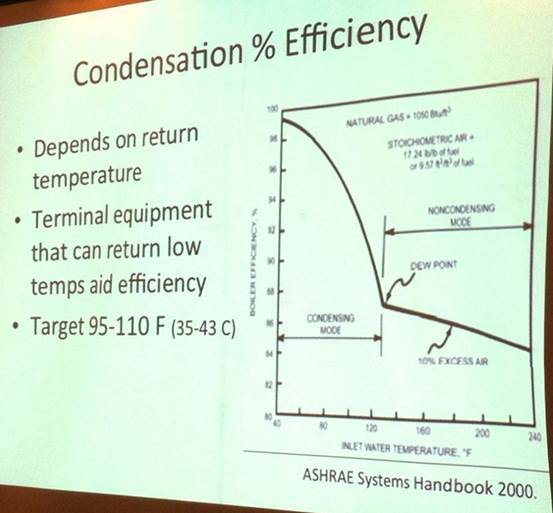
(from http://www.greenbuildingadvisor.com/blogs/dept/guest-blogs/sizing-modulating-condensing-boiler )
But instead it looks like this:
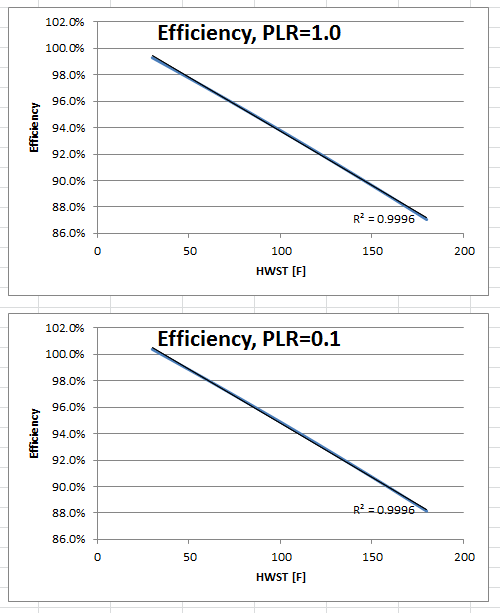
The trendlines are almost exactly linear. I don't think I've made an error plotting the curve, and you can see just from inspecting the coefficients that for a PLR held constant the supply temperature terms are quite small, especially the quadratic one.
Does this data really represent a condensing boiler?


