Modeling Variable Speed Refrigeration Compressors in Open Studio


Hello,
I am new to modeling refrigeration systems in Open Studio. I believe I have the basics down for modeling simple systems, but I wanted to know if there a way to model variable speed compressors in Open Studio?
A basic walk-in refrigeration system is outlined below. I have attached performance curves for a variable speed compressor from the Danfoss software CoolSelector2. Would you have any advice on how to model a variable speed compressor with the provided performance curves?
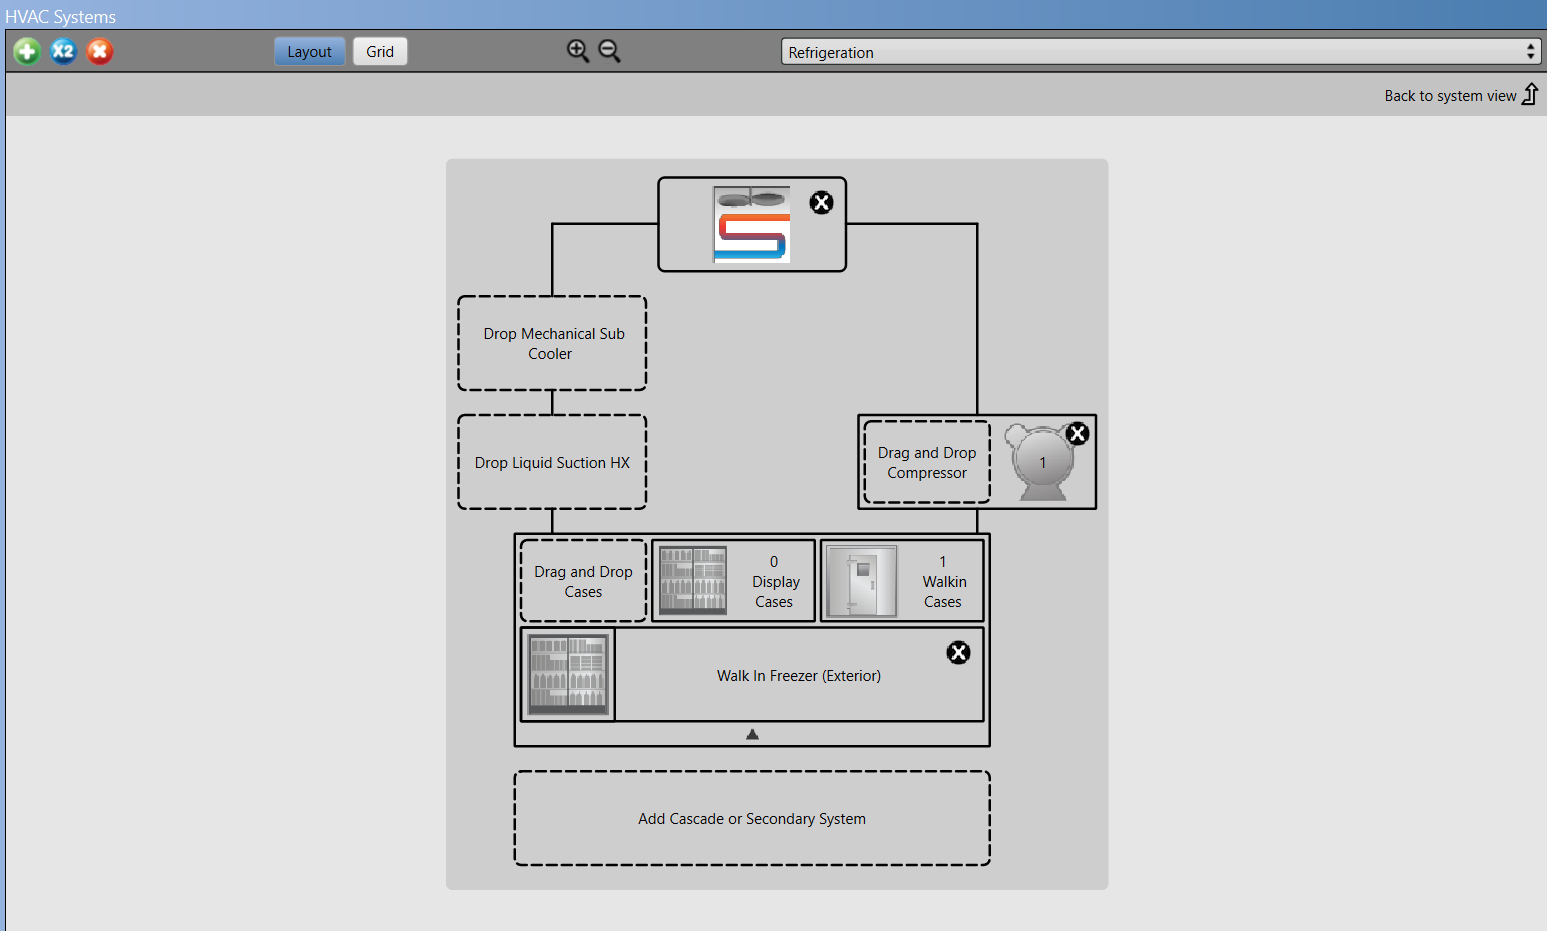 Figure 1: Basic Walk-In Cooler System Open Studio
Figure 2 shows performance curves based on different frequency or compressor speeds while the polynomial in the Figure 3 tab has 30 coefficients, which looks to account for compressor speed in the equation. OpenStudio utilizes the bi-cubic curve for compressor performance so the curve in Figure 3 can’t be entered into OpenStudio.
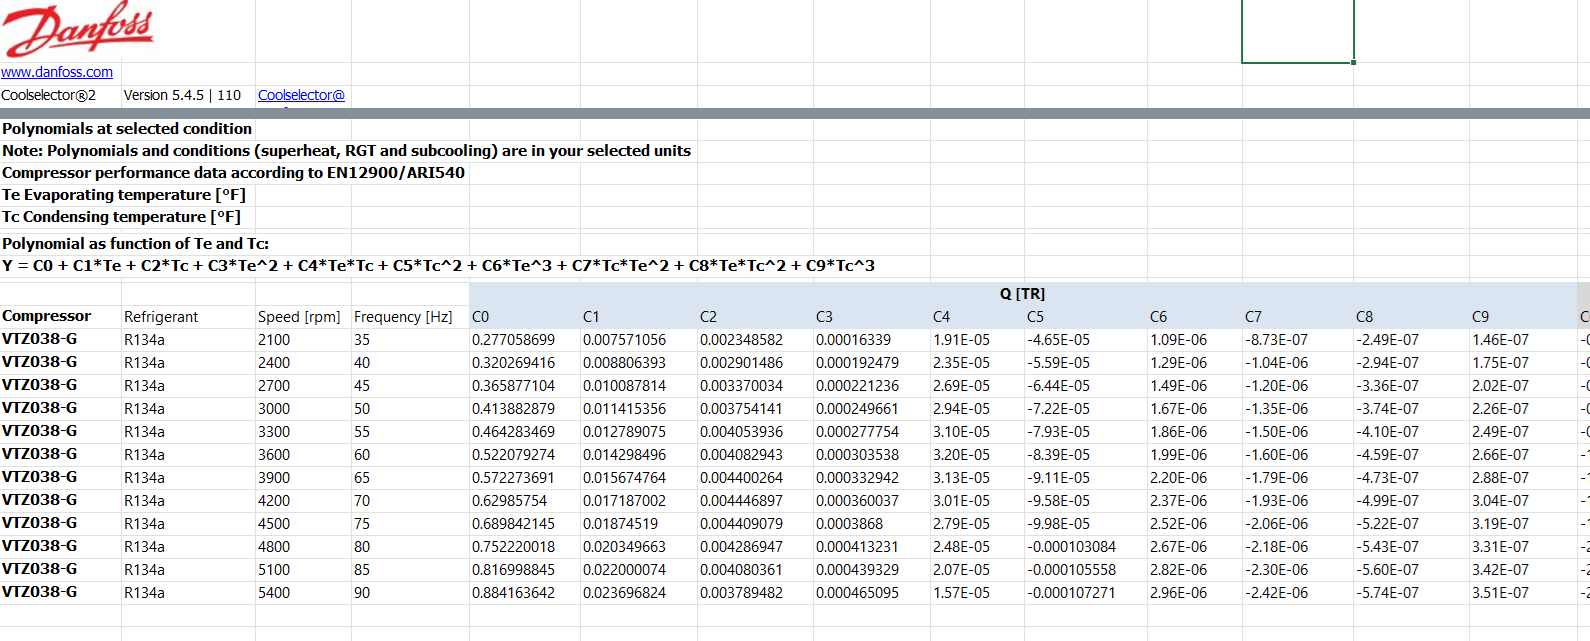 Figure 2: Variable Speed Compressor Capacity Curves
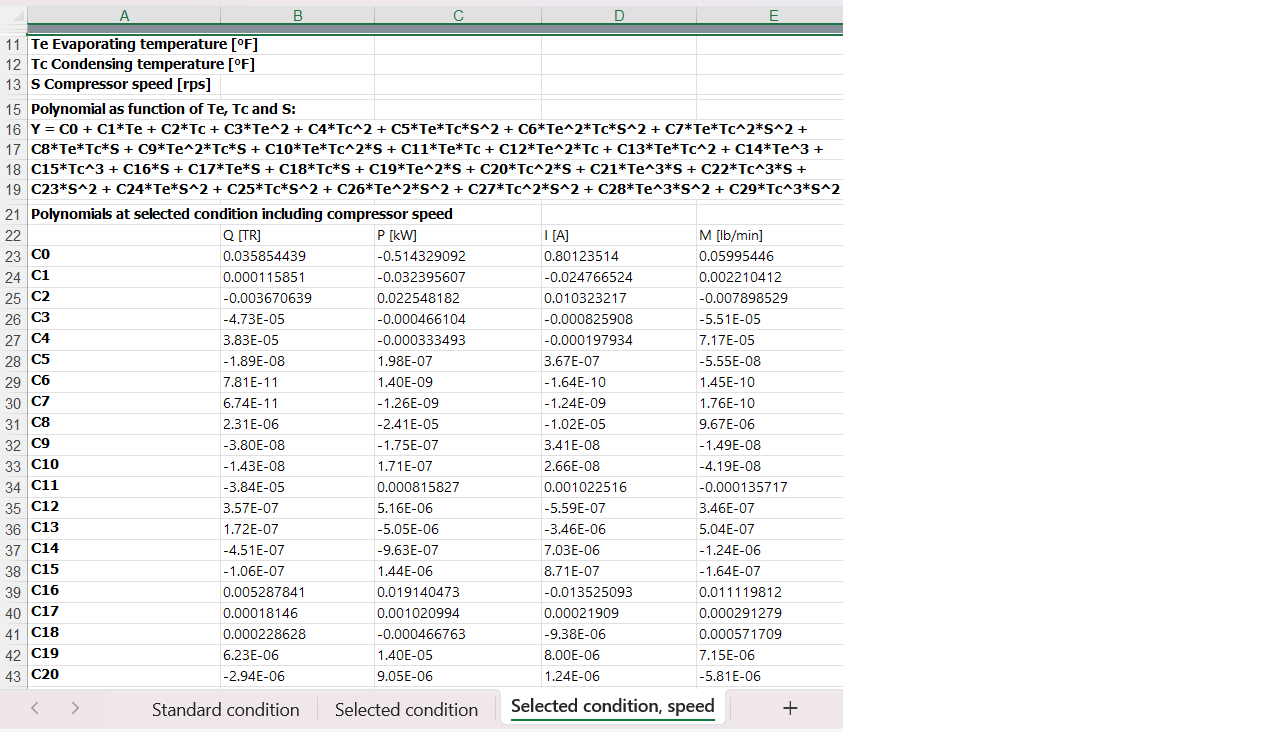 Figure 3: Variable Speed Compressor Capacity Curves with Speed Variable


This is actually a limitation in E+ with regards to refrigeration system modeling, which has not been updated in a long while and is out of date with respect to modern equipment and strategies. The compressors operate as on/off and E+ doesn't really track refrigeration "unmet loads" other than to try to pass them to a future timestep (be wary of undersized compressors). If you are savvy with EMS routines you could pick a handful of frequencies and treat each as its own compressor, then create a control scheme to match the curve to the load at each timestep. Always check your outputs!!!
Thanks Craig, I figure the refrigeration system (compressors) are cycling on/off based on the temperature setpoint of the cooler box. But yes, it doesn't appear to be obvious in the output report whether loads are met. I suppose one could look at the temperature in the cooler box on 15 minute or hourly intervals. I suppose I could use design software like CoolSelector 2 at different ambient conditions and see what perfromance curves they most closely match. After looking at frequency distributions of local ambient air temperatures I could plug in the average performance curves into E+.
The problem is that the cooler temps won't reflect the fact that the compressors are maxed out. You can test it by putting a purposefully undersized compressor on a loop. The compressor will just show as being constantly maxed out but the rest of the loop will behave as if the load were met at the compressor. Basically you should be wary if at any point in the simulation you max out all compressors.
I agree you might be able to devise "average" performance curves, But keep in mind you're a little tied to the conditions you pre-assumed to make the curve and it won't be responsive if you're testing a broad range of scenarios. Sort of like setting an IEER distribution. From my exploration this isn't necessarily unique to E+ either, most refrigeration tools out there are steady state and rather limited. I think E+ / OS are actually pretty good relative to what's out there but to do it well you'll need to tap into Python EMS capabilities. Unfortunately I'm not an expert on that.