Using Power BI for visualizations, any tips?
I am investigating how to use Power BI to visualise the data that comes from E+ simulations with DesignBuilder. DB has a great ResultsViewer program, but it does not easily allow a strong visualisation of the data. i.e. I wouldnt use it to show clients the results from the simulation. Excel can do a lot but has its own limitations and since we are considering using online portals with returning clients it seems like the right time and place to up our data visualisation skills and tools.
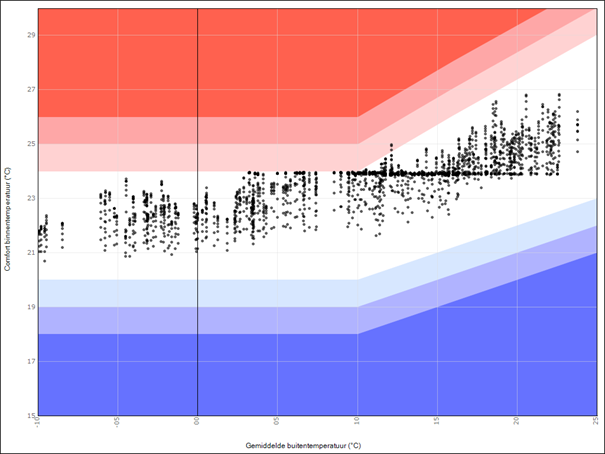
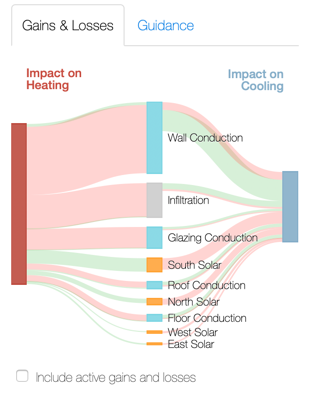
It also does not produce the kinds of graphs as attached, which we also prefer to use for discussions with clients, since they easily convey the message.
Does anyone have experience in using Power BI for this? Can the data set .eso file easily be loaded into a program like that or does it require converting to csv/txt? I'm curious to hear what experience others have!


@AadriaanW I never used PowerBI but I can provide comments re the DesignBuilder software and EnergyPlus engine. The output variables and meters that you can see in eso can be also exported to SQL and CSV file formats. These file formats are much more common compared to .eso.
https://designbuilder.co.uk/helpv7.3/...
Great, thank you so much for this tip. I was indeed wondering about the .eso file and if it could work, but SQL / CSV is much more common for Power BI I believe.