Question-and-Answer Resource for the Building Energy Modeling Community
Get started with the Help page
Ask Your Question
0

why my results from eplusout file result is starting from may 21st (2002) and not from january?

asked 2024-05-18 07:08:41 -0500

ajith's avatar

updated 2024-05-18 17:28:29 -0500

My eplusout results (attached the image) starts the output values from May 21st, 2002 (not outputing values from start of the year not from January. How to get values from january to december for a particular year in eplusoput results (for example zone air temperature). Also, i have set the calender year to 2023, but still the eplusout output file shows 2002. How to solve it. There is irregular portion in the starting! not sure why this is happeningimage description

edit retag flag offensive close merge delete

Comments

@ajith can you upload your model to Google Drive, Dropbox, etc. and then share a URL for others to download? That would help others provide better solutions.

Aaron Boranian's avatar Aaron Boranian  ( 2024-05-18 17:28:54 -0500 )edit

Sure Aaron, Please find the model here :

https://drive.google.com/file/d/1SvoJ...

Location: Kolkata, India

ajith's avatar ajith  ( 2024-05-19 01:55:47 -0500 )edit

1 Answer

Sort by ยป oldest newest most voted
1

answered 2024-05-19 09:32:23 -0500

updated 2024-05-20 09:07:01 -0500

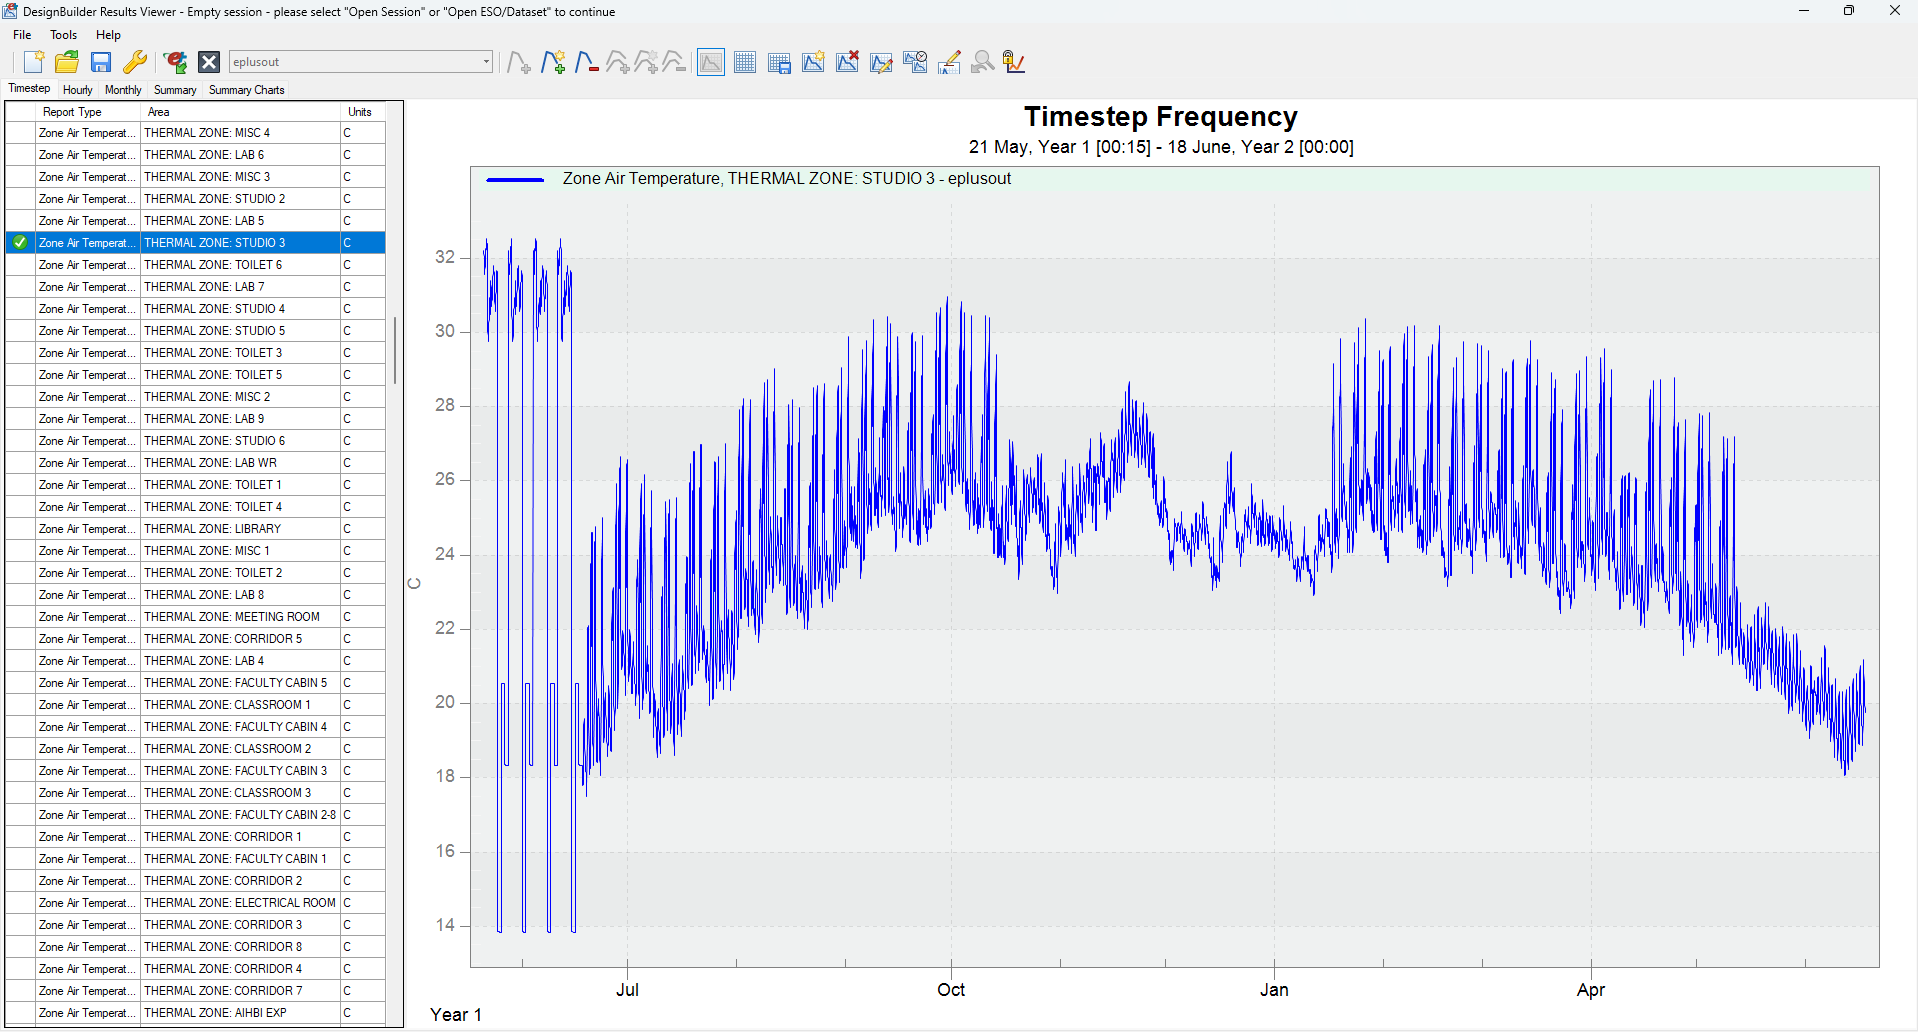
Your simulation also includes four summer and three winter design days, so the May days you see plotted first are the summer design days. Example below:

OS:SizingPeriod:DesignDay,
  {91109fb7-76a6-4e00-8ec6-a063927f4449}, !- Handle
  CALCUTTA Ann Clg .4% Condns Enth=>MDB,  !- Name
  34.6,                                   !- Maximum Dry-Bulb Temperature {C}
  9.1,                                    !- Daily Dry-Bulb Temperature Range {deltaC}
  101253,                                 !- Barometric Pressure {Pa}
  2.7,                                    !- Wind Speed {m/s}
  180,                                    !- Wind Direction {deg}
  ,                                       !- Sky Clearness
  No,                                     !- Rain Indicator
  No,                                     !- Snow Indicator
  21,                                     !- Day of Month
  5,                                      !- Month
  SummerDesignDay,                        !- Day Type
  No,                                     !- Daylight Saving Time Indicator
  Enthalpy,                               !- Humidity Condition Type
  ,                                       !- Humidity Condition Day Schedule Name
  23,                                     !- Wetbulb or DewPoint at Maximum Dry-Bulb {C}
  ,                                       !- Humidity Ratio at Maximum Dry-Bulb {kgWater/kgDryAir}
  97800,                                  !- Enthalpy at Maximum Dry-Bulb {J/kg}
  DefaultMultipliers,                     !- Dry-Bulb Temperature Range Modifier Type
  ,                                       !- Dry-Bulb Temperature Range Modifier Day Schedule Name
  ASHRAETau,                              !- Solar Model Indicator
  ,                                       !- Beam Solar Day Schedule Name
  ,                                       !- Diffuse Solar Day Schedule Name
  0.849,                                  !- ASHRAE Clear Sky Optical Depth for Beam Irradiance {dimensionless}
  1.353;                                  !- ASHRAE Clear Sky Optical Depth for Diffuse Irradiance {dimensionless}

Note the Day of Month and Month inputs above for 21 May on this SummerDesignDay.

If you don't want to include these time-series outputs from design days, set the Run Simulation for Sizing Periods to "Off". HOWEVER, note that this will also turn off any summary tables for design days as well.

See related post here.

UPDATE

You need to run a new simulation after making these input changes in order to generate different output files. I've made a modified OSM from the copy on your Google Drive folder, where I've only made the Simulation Control changes below:

image description

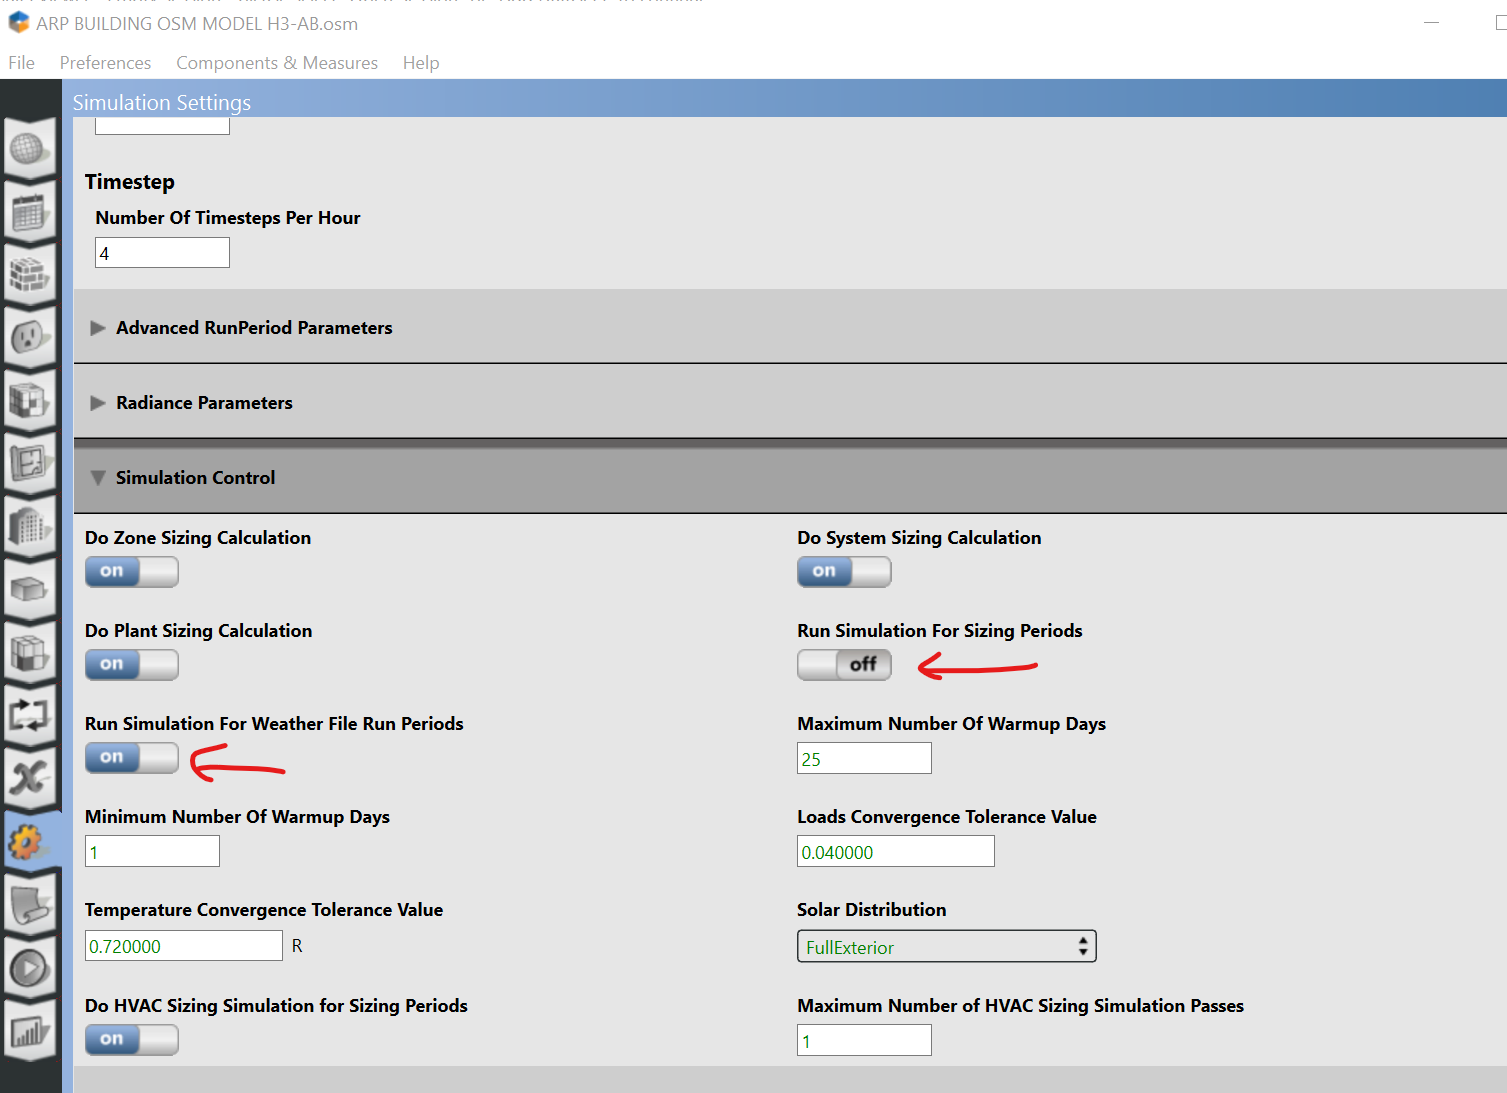
You previously had these flipped (Sizing Periods was "on", Weather File Run Periods was "off"). After saving and running a new simulation, the ESO file you plot in DesignBuilder Results Viewer has data for Jan-Dec.

image description

I don't have permissions to upload this modified OSM to your Google Drive folder. If my instructions above are not clear enough, please change the sharing settings in the folder so that I can upload my modified file for you to review.

edit flag offensive delete link more

Comments

@Aaron Boranian , Hello thank you so much for your inputs, I did what you suggested, turning off weather run periods to 'off', Now the irregular pattern is gone, but the simulation is just running for 1 month, starting from May. I am attaching screenshots for your reference. I have set the run period from january to december, still its not giving me results for a complete year (that too for 2002, i have set the calender year as 2023) please see the link here :

https://drive.google.com/drive/folder...

ajith's avatar ajith  ( 2024-05-19 13:27:07 -0500 )edit

@ajith sorry for the confusion, I mixed up which option to turn off. It should be Run Simulation for Sizing Periods, not Weather File Run Periods. I've updated my answer above.

Aaron Boranian's avatar Aaron Boranian  ( 2024-05-19 16:15:08 -0500 )edit

@Aaron Boranian , still the results start from May. Not from January to December in design viewer, that too for 2002 ( Calender year is set to 2023). Please check the model results.

ajith's avatar ajith  ( 2024-05-20 04:39:45 -0500 )edit
1

@ajith I just updated my answer after being able to modify your OSM to plot annual results.

Aaron Boranian's avatar Aaron Boranian  ( 2024-05-20 09:07:20 -0500 )edit

@Aaron Boranian, Hi, I deleted all the design days (from site tab) and ran the simulation as Aaron mentioned above (same simulation control settings) , and it worked. Thanks for the help.

ajith's avatar ajith  ( 2024-05-20 11:34:01 -0500 )edit

Your Answer

Please start posting anonymously - your entry will be published after you log in or create a new account.

Add Answer

Training Workshops

Careers

Question Tools

1 follower

Stats

Asked: 2024-05-18 07:08:41 -0500

Seen: 111 times

Last updated: May 20