Adaptive model acceptability status


Hi all. I am using the adaptive comfort model from ASHRAE 55 in OpenStudio. I use DView to see results from my project. I chose to include in Dview “Zone thermal comfort ASHRAE 55 adaptive model running average outdoor air temperature”, “Adaptive model temperature”, and “Adaptive model 80% acceptability status”. For the “Adaptive model 80% acceptability status”, the input output energy plus reference says that a value of 1 indicates that zone operative temperature is under limits, 0 is outside limits, and -1 is the running average outdoor temp is outside the range of 10.0 to 33.5C.
However, in the graph attached one can see that the operative temperature is closer to the adaptive model temperature than 3.5°C, however, there are various instances when the value of Adaptive model 80% acceptability status is 0 or -1. For example, during 9 to 15 hours, operative temperature is closer than 3.5°C (at 12 hours is almost the same value) but the Adaptive model 80% acceptability status indicates has a value of 0, saying that there is a different greater than 3.5°C between Adaptive model temperature and the operative temperature, but it doesn’t happen. I think that it would be great to have a object with the upper and lower 80% limit for the adaptative model.
I appreciate any insight about this. Regards.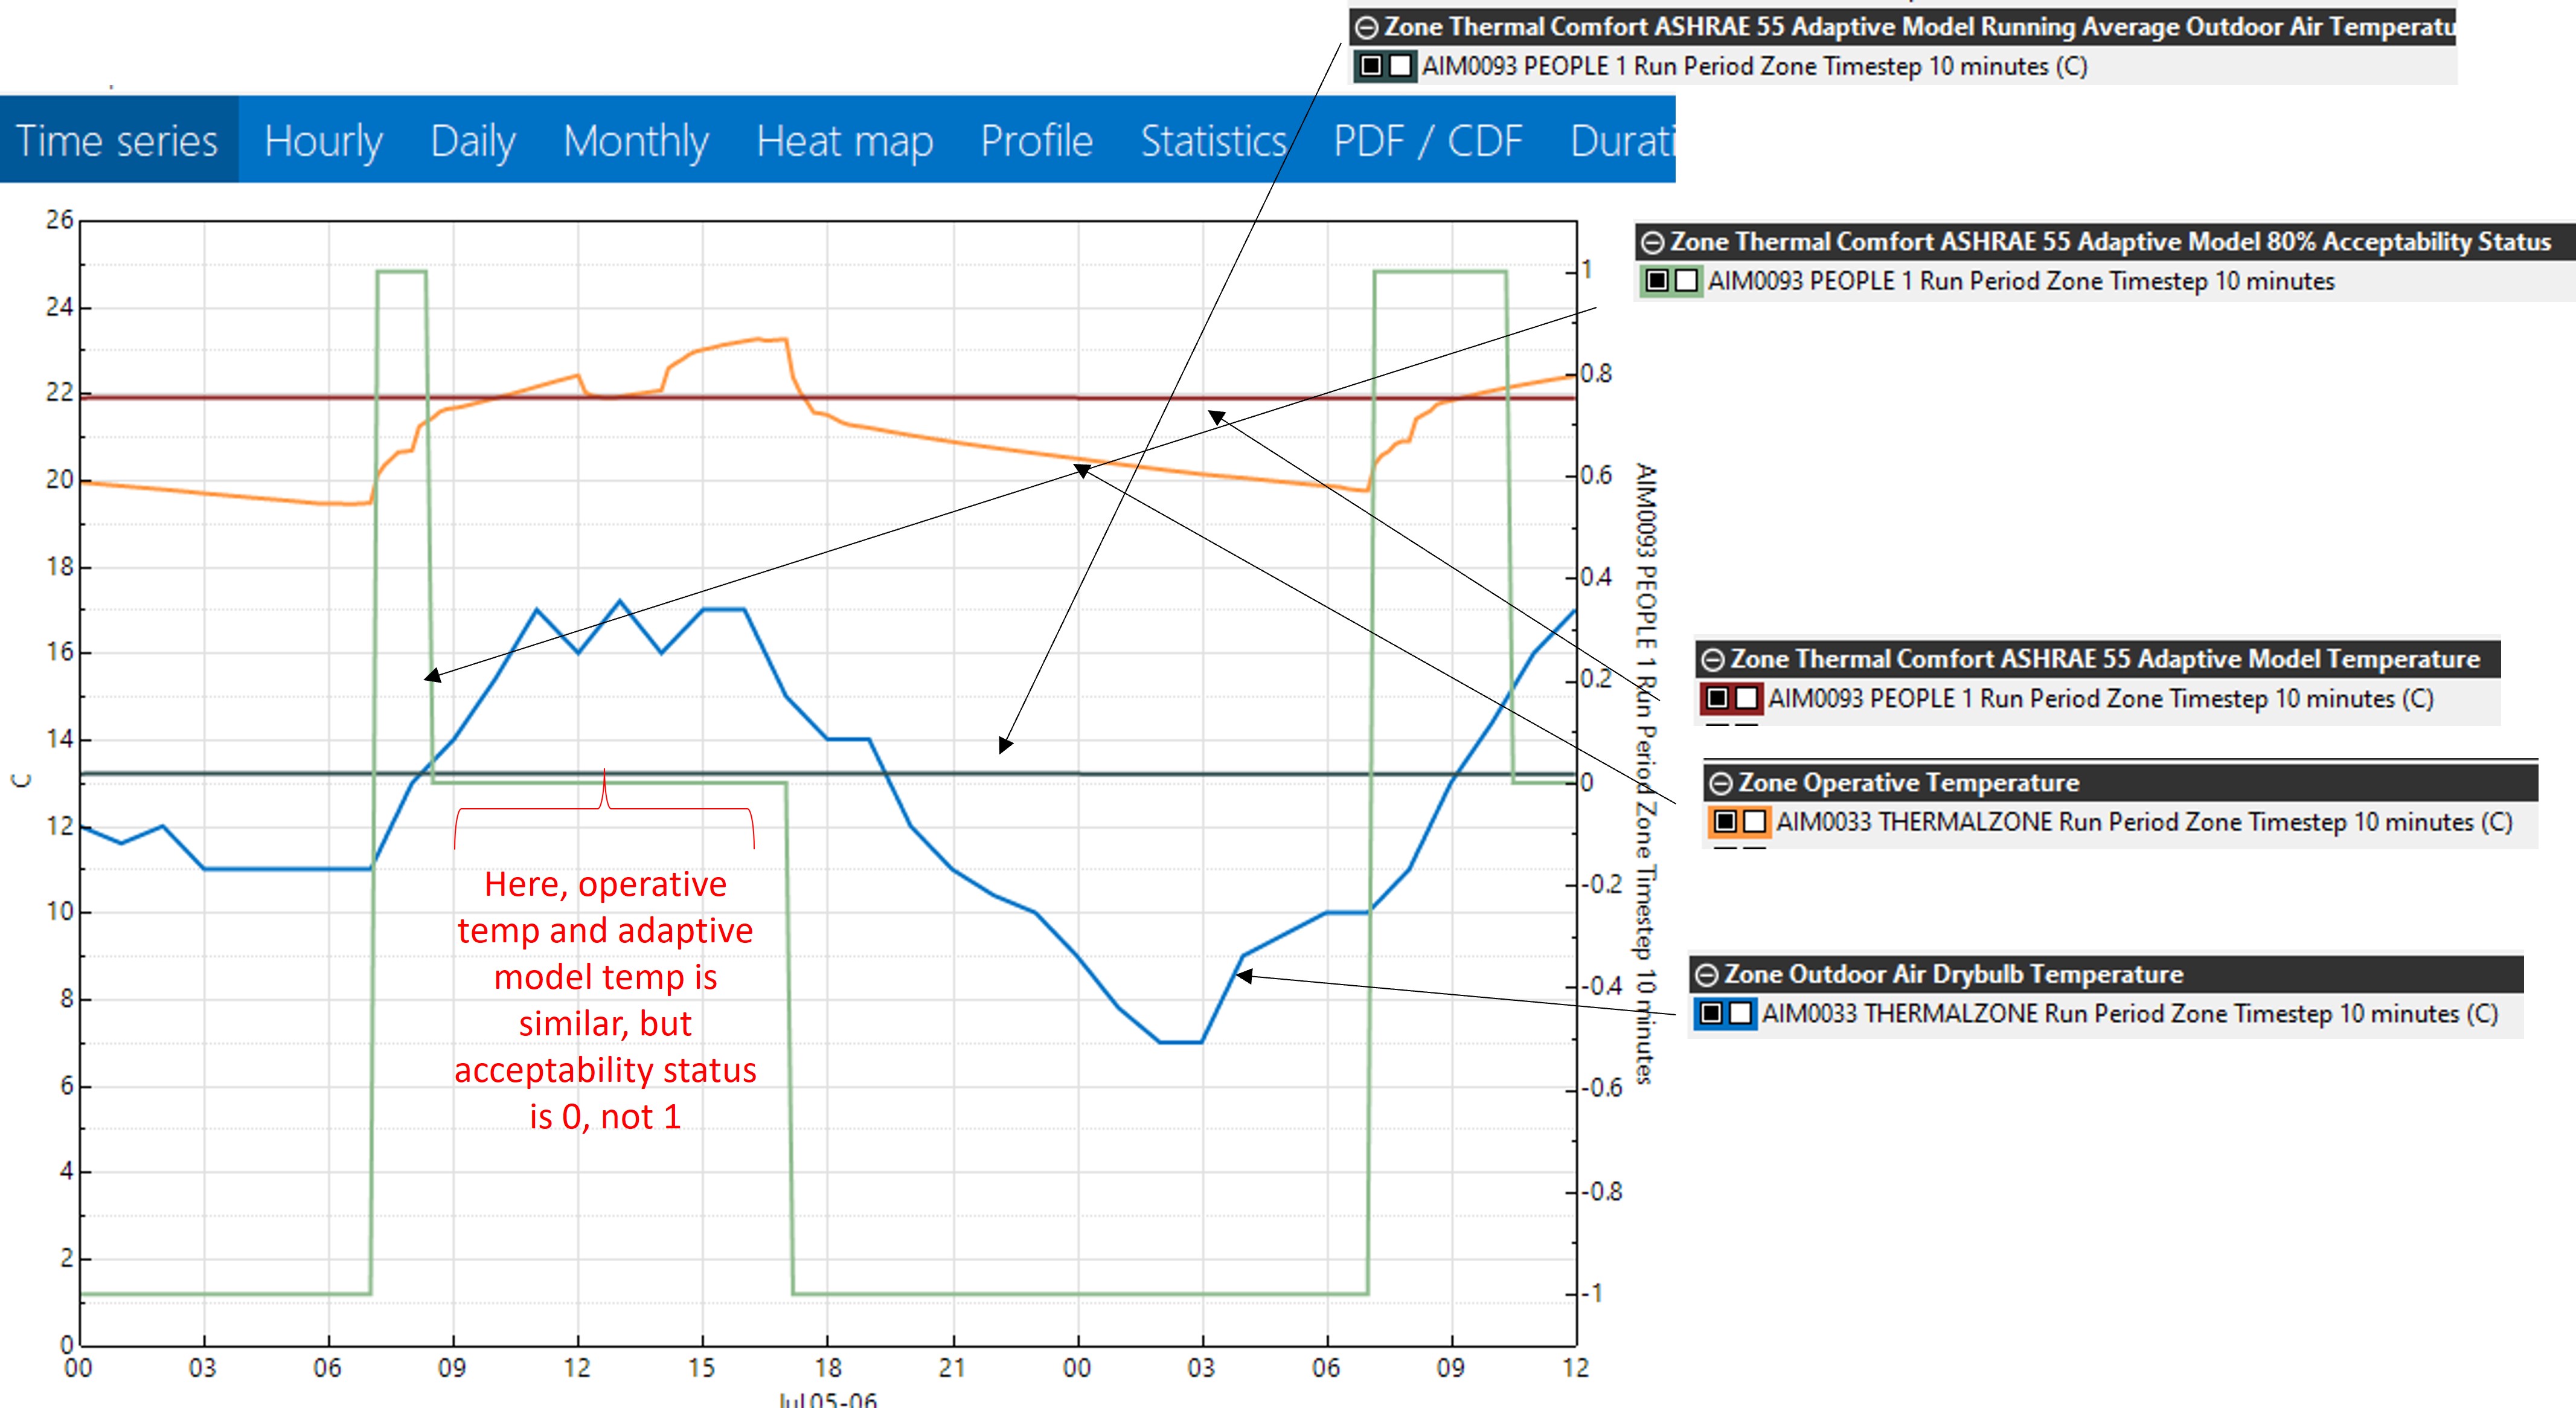


You mention a "graph attached" (2nd paragraph)?
Hi Denis, I was uploaded a image using a PNG format. Now, I tried igain using a JPG format and it worked. Thanks