Plot Zone Temperature with Energyplus


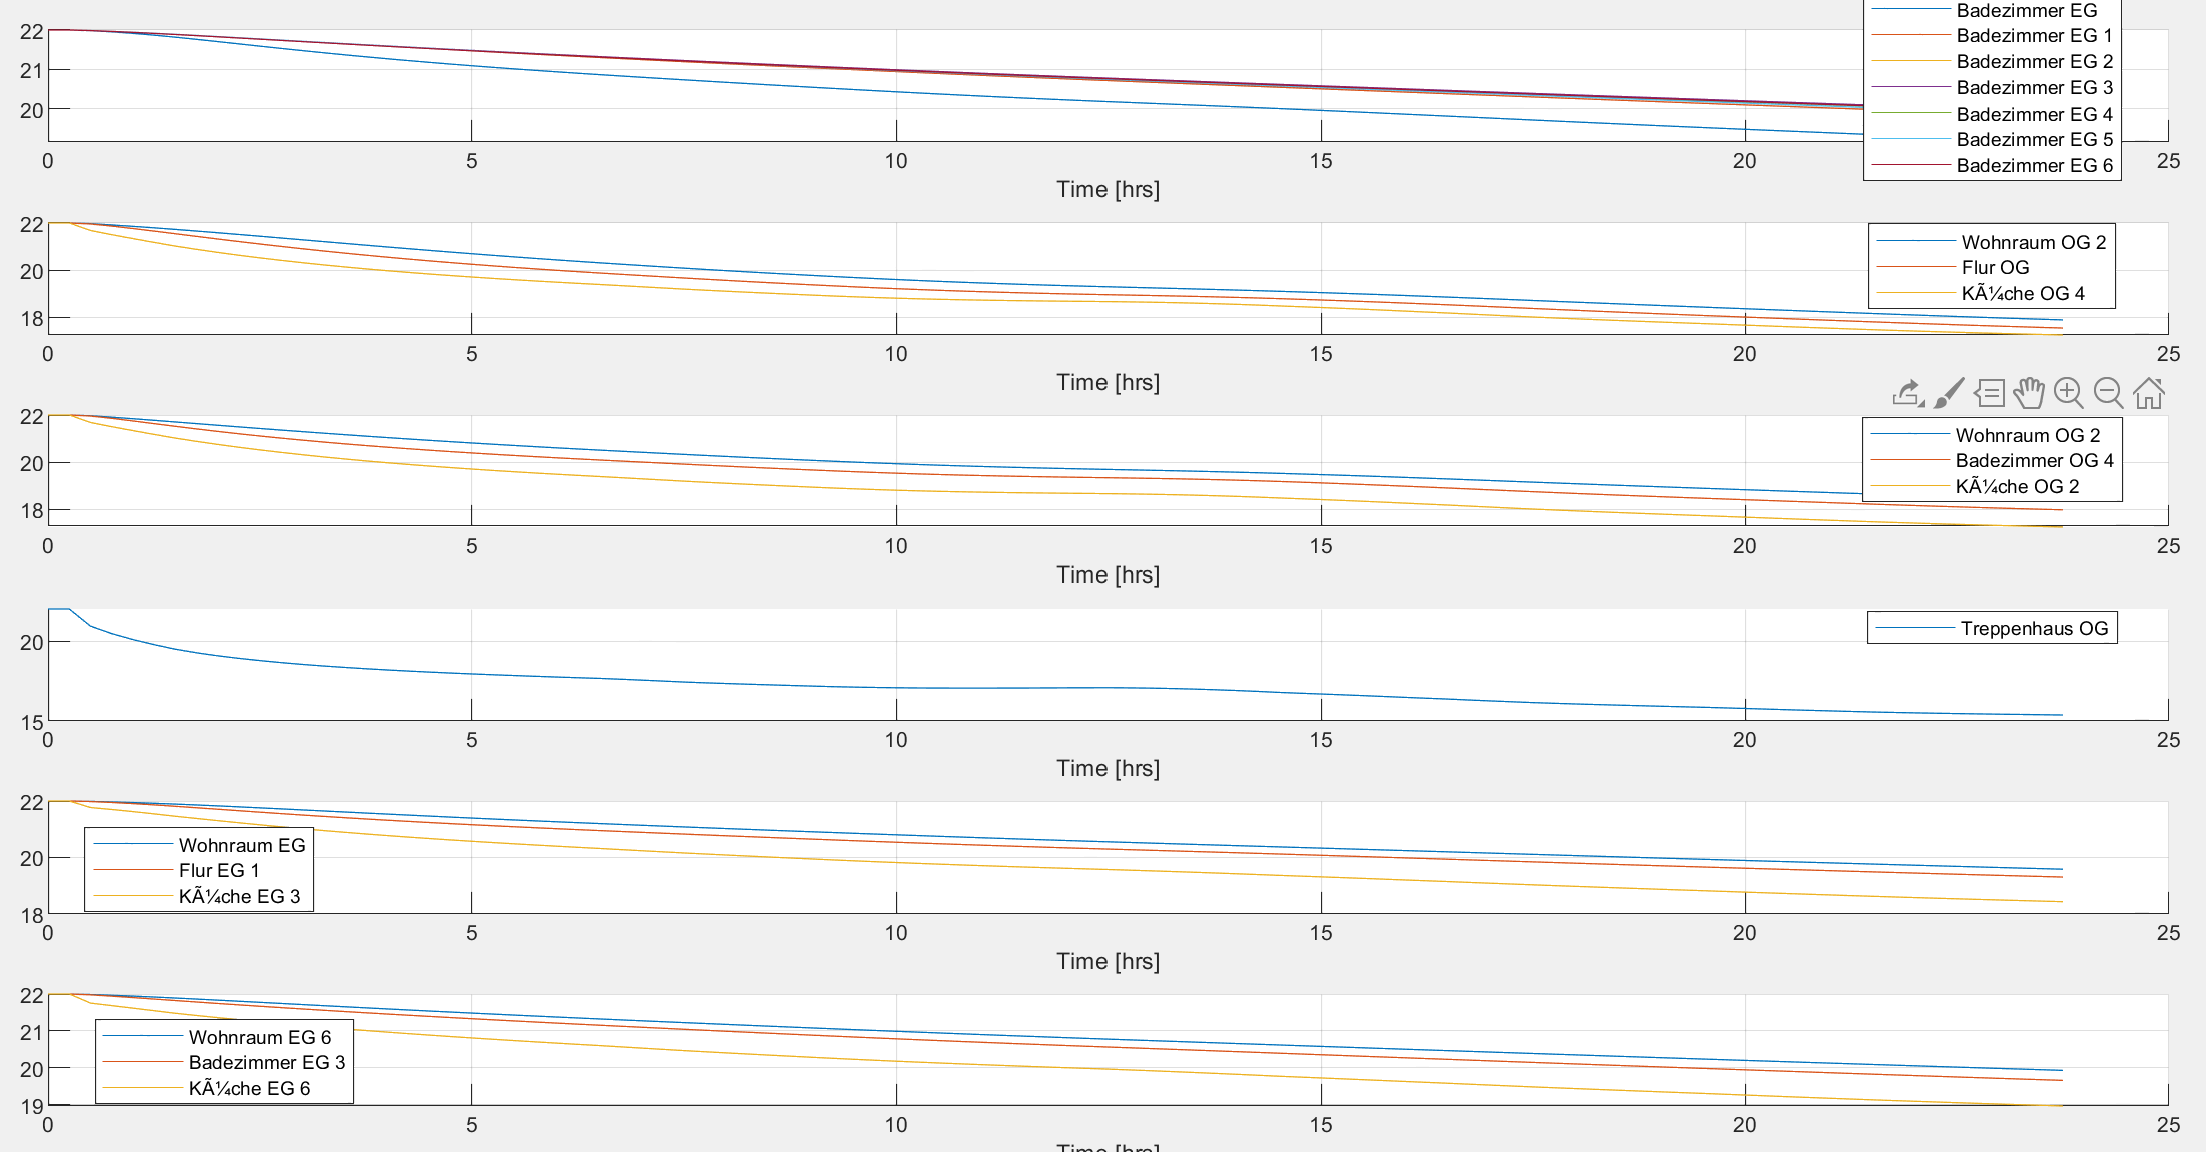
I am trying to compare a model created through a Matlab toolbox with an Energyplus model. Therefore I want to compare the changes in the Room Air Temperatur of specific Zones of the buildiung. I set the initial zone-temperature to 22°C in the toolbox and used the weather data of a specific day, which I also picked in Energyplus (find the plot attached). Now I want to set the Initial Temperaure of energyplus to the same 22°C or adapt the Matlab version to the initial temperature, which is set by Energyplus. Therefore I need a plot of some specific Zones from the Energyplus simulation. I want to try this with the "ReadVarsEso" tool or with the .csv-file. Thus I tried to get those files by setting the "OutputControl:Files" to "yes", but I do not get the needed files after the simulation. What can cause this problem?
I also do not know which "variable name" I have to choose to obtain specific zone air temperatures in "Output:Variables". Moreover do someone have some recommendations, whether I should use the.csv-file or the "ReadVarsEso- tool for plotting?

@Sneog does this post and/or this post answer your question about how to generate output variables from EnergyPlus? For the starting temperature in each zone, this is where the warmup process used by EnergyPlus is important to understand.
This warmup process initializes zone and surface temperatures to 23C, but then the final "converged" temperatures can be different at the end of the warmup process, and these final values are what's used at the start of the actual environment (design day or run period) where results are provided. You can read more in posts here and here.