Question-and-Answer Resource for the Building Energy Modeling Community
Get started with the Help page
Ask Your Question
3

EnergyPlus Wall Heat Transfer

asked 2015-07-17 14:52:04 -0500

Tim Johnson's avatar

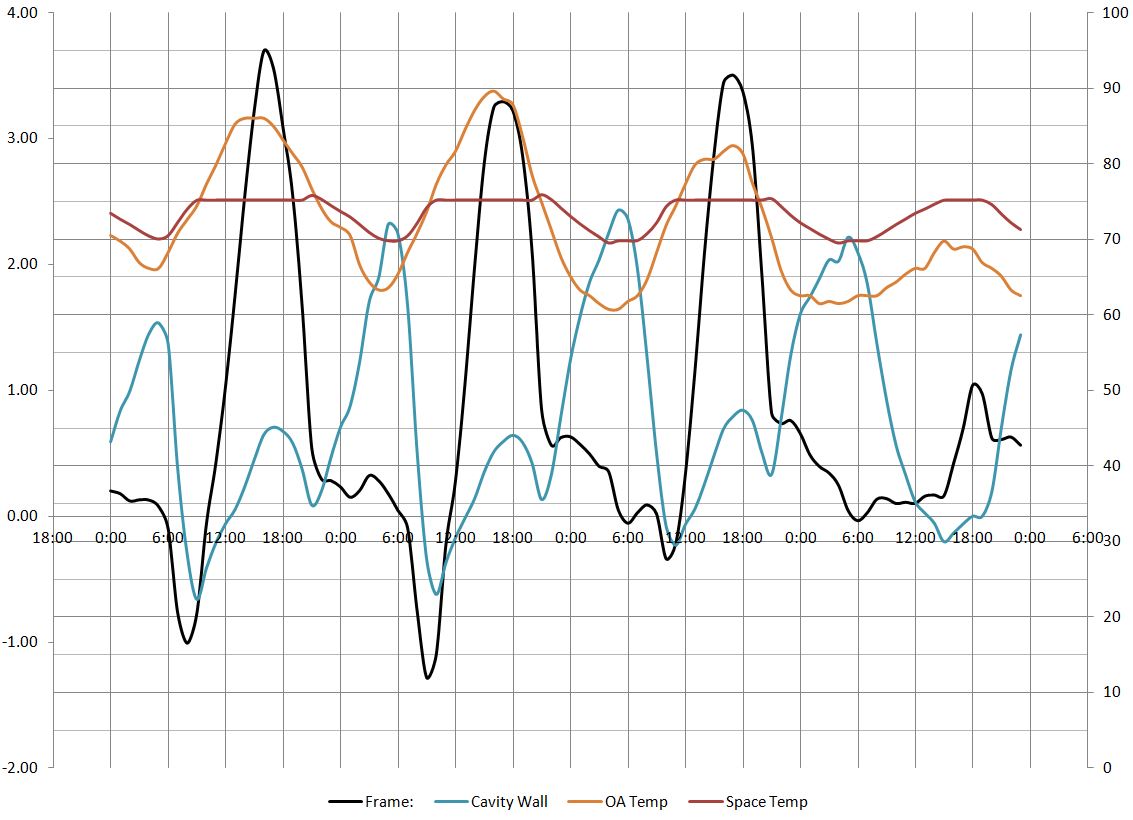
I am looking to show the impact of thermal mass on building performance and looking for an hourly report that shows the time delay and peak load shaving that is typical of a thermally massive wall. EnergyPlus outputs include conduction, convection, radiation, and storage variables, but I am struggling to interpret the results and their relation to the zone.

Intuitively, I figured the convection and radiation components of the inside surface would add up to the heat transfer to the space, but the results don't match the trends I was expecting. This sum shows the shift in peak load, but a mass wall of similar U-value has much higher peaks than a frame wall.

The table outputs show a peak load for each zone, but I am looking for hourly trends and would like to evaluate walls by exposure. I am not looking for the total zone wall heat transfer.

Can someone shed some light on this for me?

Thanks, Tim

edit retag flag offensive close merge delete

2 Answers

Sort by ยป oldest newest most voted
3

answered 2015-07-17 16:18:30 -0500

updated 2015-07-17 16:22:08 -0500

I'm not entirely sure I know what you are looking for. There is no single hourly report that can give time delay and peak load shaving. You'll have to post-process the results from separate simulations.

The heat transfer from the surface to the space is purely convective. Radiation from the surface is only transferred to other surfaces. If you want to compare different surfaces, I imagine you'll want to compare the "Surface Inside Face Convection Heat Gain Rate".

It is difficult to explain the difference between the two wall types without knowing more about the construction properties.

edit flag offensive delete link more

Comments

Thanks Neal. That clears things up for me a little bit. I was figuring the radiation load was transferring to the space somehow. I am comparing a steel frame wall to a more massive wall with brick/air gap/insulation/CMU. I am just looking for a graphical representation of the wall performance and I think this information gets me there.

C:\fakepath\Wall Performance Chart.JPG

Tim Johnson's avatar Tim Johnson  ( 2015-07-17 17:04:23 -0500 )edit
2

answered 2015-07-20 11:18:11 -0500

Archmage's avatar

I think what you are after is naturally complicated and there is not really an easy way to report or interpret such information. I would suggest plotting these two output variables together as an x-y scatter plot.

Surface Inside Face Convection Heat Gain Rate per Area vs. Surface Heat Storage Rate per Area

The time delay issue is tricky here so you might try requesting daily frequency as well as hourly. Or process the hourly data into something like an 8-hour moving average.

edit flag offensive delete link more

Comments

I am hoping to show the interaction between the wall and the space. The convection gains seem to show that fairly well, but let me know if I am over simplifying the issue. In my mind, the surface heat storage rate is internal to the wall and is what causes the delay and peak shaving. The impact of that delay and peak shave can be seen in the hourly convection gain. See the attached .jpg on my response to Neal's comments.

Tim Johnson's avatar Tim Johnson  ( 2015-07-20 13:58:19 -0500 )edit

Sure that looks fine and I don't think you are oversimplifying. I mainly wanted to point out that the "per Area" output is a bit more general if looking at a mix of different surfaces and the cross correlation with wall storage might help explain "why" the delay is happening.

Archmage's avatar Archmage  ( 2015-07-20 14:33:43 -0500 )edit

Your Answer

Please start posting anonymously - your entry will be published after you log in or create a new account.

Add Answer

Careers

Question Tools

1 follower

Stats

Asked: 2015-07-17 14:52:04 -0500

Seen: 1,622 times

Last updated: Jul 20 '15