BEopt Output - What am I Missing
Hi, In order to ask my question, I would like to upload a couple of screenshots, but I don't have enough points yet.
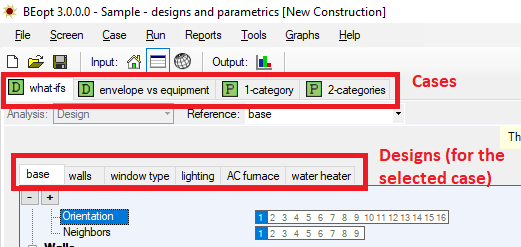
I created a Design, and created (3) Cases: Base, Windows, Exterior Rigid Foam. I'm trying to analyze different options: Window U-factor, Exterior Rigid Foam, etc. I have tried it A BUNCH of different ways: In Design Mode, Parametric, and Optimization. At first, I tried with BEopt version 3.0.0.0. And then I tried it with BEopt version 2.8.0.0. Sometimes with multiple things selected. For example, two types of windows. Sometimes with only (1) change per case.
With three Cases, shouldn't I get 3 points on the graph in the upper left, and 3 columns on the graph in the lower left? Each time I run it, I get less than that.
I have watched the BEopt training videos. I feel like I'm missing something simple. Is there a way to make it analyze these three different cases?
Thanks in advance for your help, Miles


@Miles if you don't have enough karma points to attach an image, you can still upload image(s) to Flickr, Imgur, or something similar and then share the URL in this post so that others can access it.
Without seeing a screenshot or project file, it will be hard to help. You can also upload files to Google Drive or Dropbox.
Thanks @Aaron Boranian and @shorowit. I uploaded the images to Imgur. Here is a link: https://imgur.com/a/skymlOt