Question-and-Answer Resource for the Building Energy Modeling Community
Get started with the Help page
Ask Your Question
3

PAT NSGA2 Algorithm problem

asked 2022-11-15 06:54:57 -0500

updated 2023-06-07 09:40:51 -0500

Hi everyone,

I have been trying to use PAT to calibrate a building model using NSGA2 as optimization algorithm. Since this analysis might take quite a lot of simulations (10.000+), parallelization is important to reduce total experiment time.

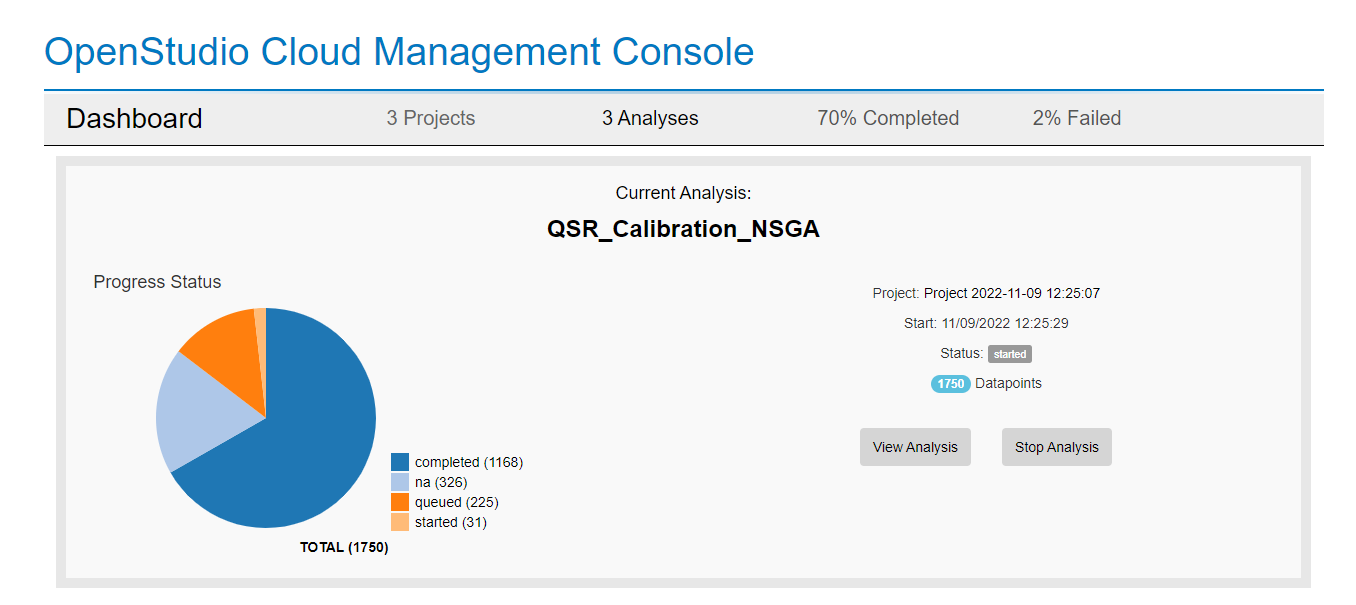
The problem i am having is that when i set the "Max Queued Jobs" algorithm setting higher than 60 some of the simulation datapoints appear as "NA" and also some as "datapoint failure" (This does not happen when that setting is bellow 60).

Since the "Number of Samples" (size of initial population) i am using is around 136, the "Max Queued Jobs" setting is limiting the max simulations i can run at the same time.

Here is an example of what happens:

image description

I am using OpenStudio-Server on AWS, with a node type "t3.xlarge".

I will post some screenshots of console errors when i have the chance.

Thanks!

Just an update:

After some testing i have managed to increase the number of "Max Queued Jobs" and consequently the number of parallel simulations by changing some of the OpenStudio-server chart settings. This are the settings i have used:

image description

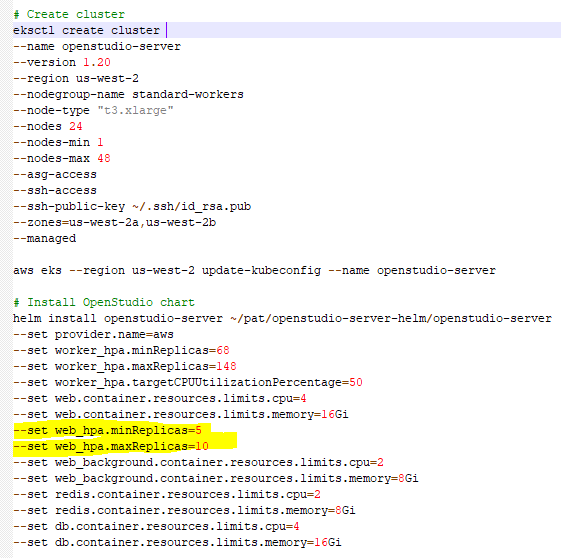
I have increased the resource limits of CPU and memory for all the workers unrelated to the simulation (web_background, etc.) but also the min and max replicas for the web pod (in yellow).

Can someone tell if this is Ok, or i am doing something wrong?

Thanks again!

edit retag flag offensive close merge delete

1 Answer

Sort by » oldest newest most voted
2

answered 2022-11-18 12:23:15 -0500

tijcolem's avatar

Hi,

Your helm install looks good minus the web node (in yellow). The web doesn't scale horizontally at the moment. We are working adding support for that but you should set that to the default of 1. Same as the web background. You can increase the resources (cpu and mem) as you already did which will help with the high traffic (worker-> web) when running that many sims. We did make a quick change to the helm repo (https://github.com/NREL/OpenStudio-se...) fix https://github.com/NREL/openstudio-se... that sets higher values for rails queue and pool sizes which I suspect is the reason you are getting those NAs. I would suggest to apply these latest changes to your helm chart and see if that fixes it.

edit flag offensive delete link more

Comments

Thank you for your answer! Ok, so the only way to improve performance of web node it would be to select a larger instance (ex. t3.2xlarge) and further increase resources limits (ex. 8cpu and 32Gb mem). Regarding the helm repo fix you mentioned, https://github.com/NREL/openstudio-se..., can i apply it to openstudio-server-helm v3.4.0? (i haven´t updated to the new version yet).

Raul Teixeira's avatar Raul Teixeira  ( 2022-11-21 08:56:54 -0500 )edit

Yes, you can apply those changes to the v3.4.0 tagged version (I can even create a branch if you prefer) or you can just use the latest develop branch on helm and change the image names for web, web-background, worker and rserve to use the v3.4.0 tagged images.

tijcolem's avatar tijcolem  ( 2022-11-21 10:28:00 -0500 )edit

I would appreciate if you could create the branch. thanks again!

Raul Teixeira's avatar Raul Teixeira  ( 2022-11-22 04:46:36 -0500 )edit

Hi again, i have tested your suggestion (clone the repo and change the images to v3.4.0), and it works. What is happening now is that in large scale analysis, once i reach around 7500 simulations, some of the simulations start getting "stuck" and never finish unless i destroy them manually.

I also get this error in Resque Dashboard after manually deleting those datapoints.

Exception Resque::PruneDeadWorkerDirtyExit Error Worker worker-659779bcdb-v6c7k:23:simulations did not gracefully exit while processing ResqueJobs::RunSimulateDataPoint

Thank You!

Raul Teixeira's avatar Raul Teixeira  ( 2022-12-07 11:53:40 -0500 )edit

My guess is the web api is getting overloaded with worker traffic with that many sims. When a worker completes a simulation, it calls the web via a rest call and submits results. If this gets dropped, it can get stuck in the processing state even though it's finished. Couple of things you can try:

1) Run fewer jobs. Maybe around 5k runs. 2 ) You can reduce the traffic on the web api by setting some result options in the OSAF json file to false if you don't need them. Example: https://gist.github.com/tijcolem/0760...

tijcolem's avatar tijcolem  ( 2022-12-08 18:03:48 -0500 )edit

Your Answer

Please start posting anonymously - your entry will be published after you log in or create a new account.

Add Answer

Careers

Question Tools

1 follower

Stats

Asked: 2022-11-15 06:54:57 -0500

Seen: 170 times

Last updated: Nov 18 '22