View simulation results in SketchUp
Hi everyone, can i view the results (inside temperature) of the simulation in google sketchup?? Thanks
This feature was removed from the SketchUp plug-in but is being replaced by the ViewData measure. The current ViewData measure has a few kinks that are being worked out, an updated version will be released in the near future.
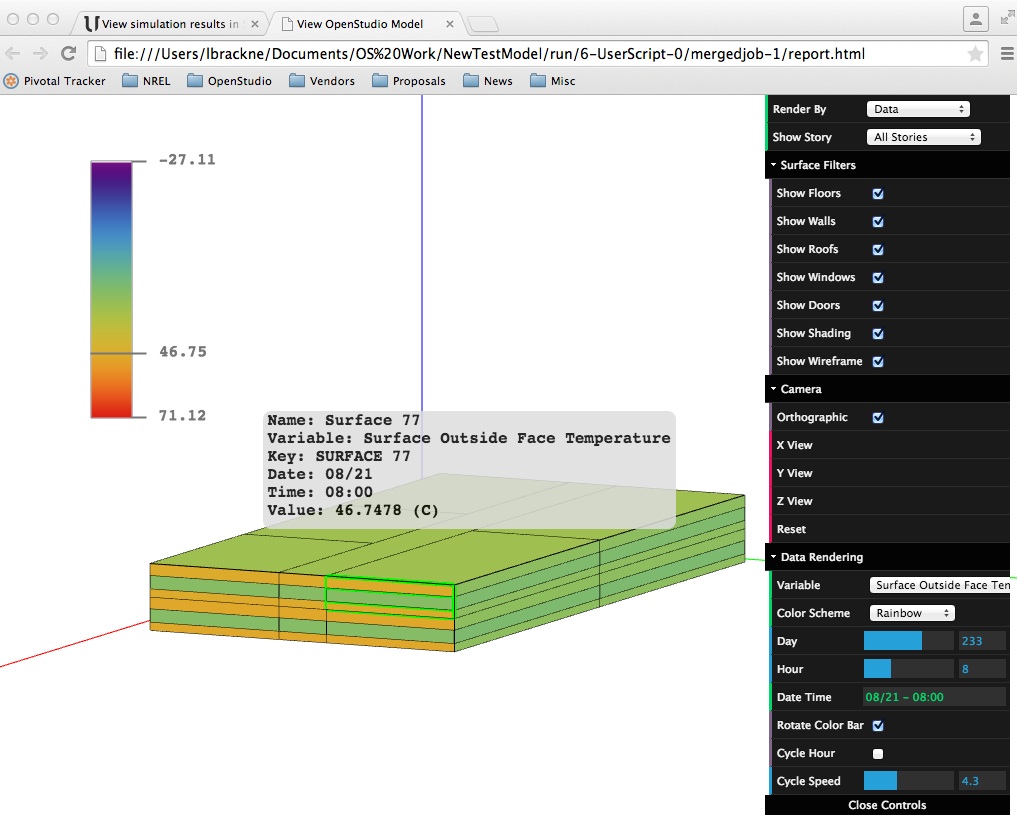
Update: Added sample output from the measure. Live demo, choose Render By Data to see this feature.

What? You couldn't embed the active control in the answer?
Pretty! How long until you have an open-source WebGL replacement for SketchUp?
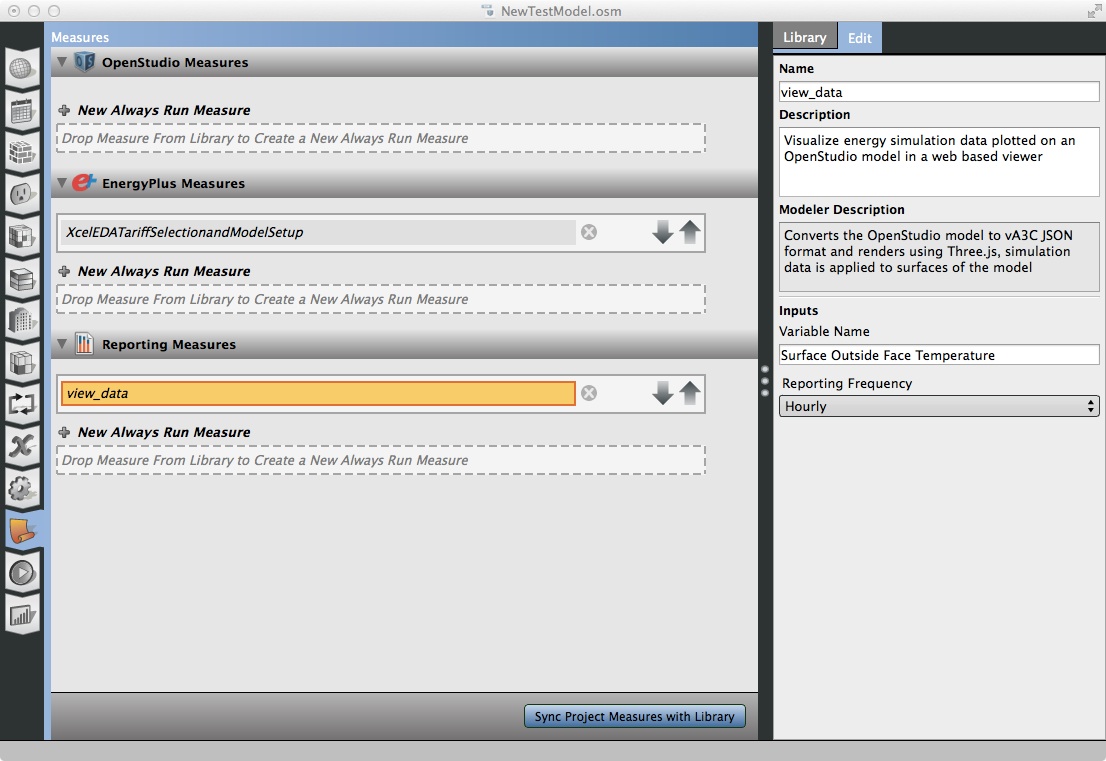
Yes, you can specify variable names for data visualization. Here is a screenshot of the measure in an analysis workflow. On the right side of the screen you can see the inputs that Dan has exposed in the measure.

Currently we support surface and zone variables, but we have talked about adding air loop variables as well. All of those are easy to map to model geometry, but for example a plant loop variable wouldn't because multiple plants may serve a specific zone. One exception we would like to add simple way to view weather data (but that isn't something we are working on now).
How can I specify variable names for data visualization? I saw that there is tha variable Zone Mean Air Temperature but I don't understand how set up it. thanks
You can find a list of available variables in the "eplusout.rdd" file, which is located in the "run" folder.
The first three lines of my "eplusout.rdd" file, when I open it in Notepad, look like this:
! Program Version,EnergyPlus, Version 9.6.0-4b123cf80f, YMD=2022.01.21 14:06,
! Output:Variable Objects (applicable to this run)
Output:Variable,*,Site Outdoor Air Drybulb Temperature,hourly; !- Zone Average
Find the variables of interest and add them to the respectable fields on the ViewData measure: https://www.youtube.com/watch?v=PlrWE3ugcdE
