Question-and-Answer Resource for the Building Energy Modeling Community
Get started with the Help page
Ask Your Question
0

Peak Heating vs Boiler Sizing

asked 2022-07-13 20:11:28 -0500

rktct999's avatar

updated 2022-07-14 13:54:12 -0500

I am running a large parametric simulation of different ECMs using Openstudio/Energy Plus (using Ironbug/Honeybee in Grasshopper to generate and run the files).

I am using the same HVAC system and internal loads on two buildings, a 4 story low rise and a 18 story high rise, using zone multipliers so I still have the same number of zones between the two buildings despite the difference in floor area and height.

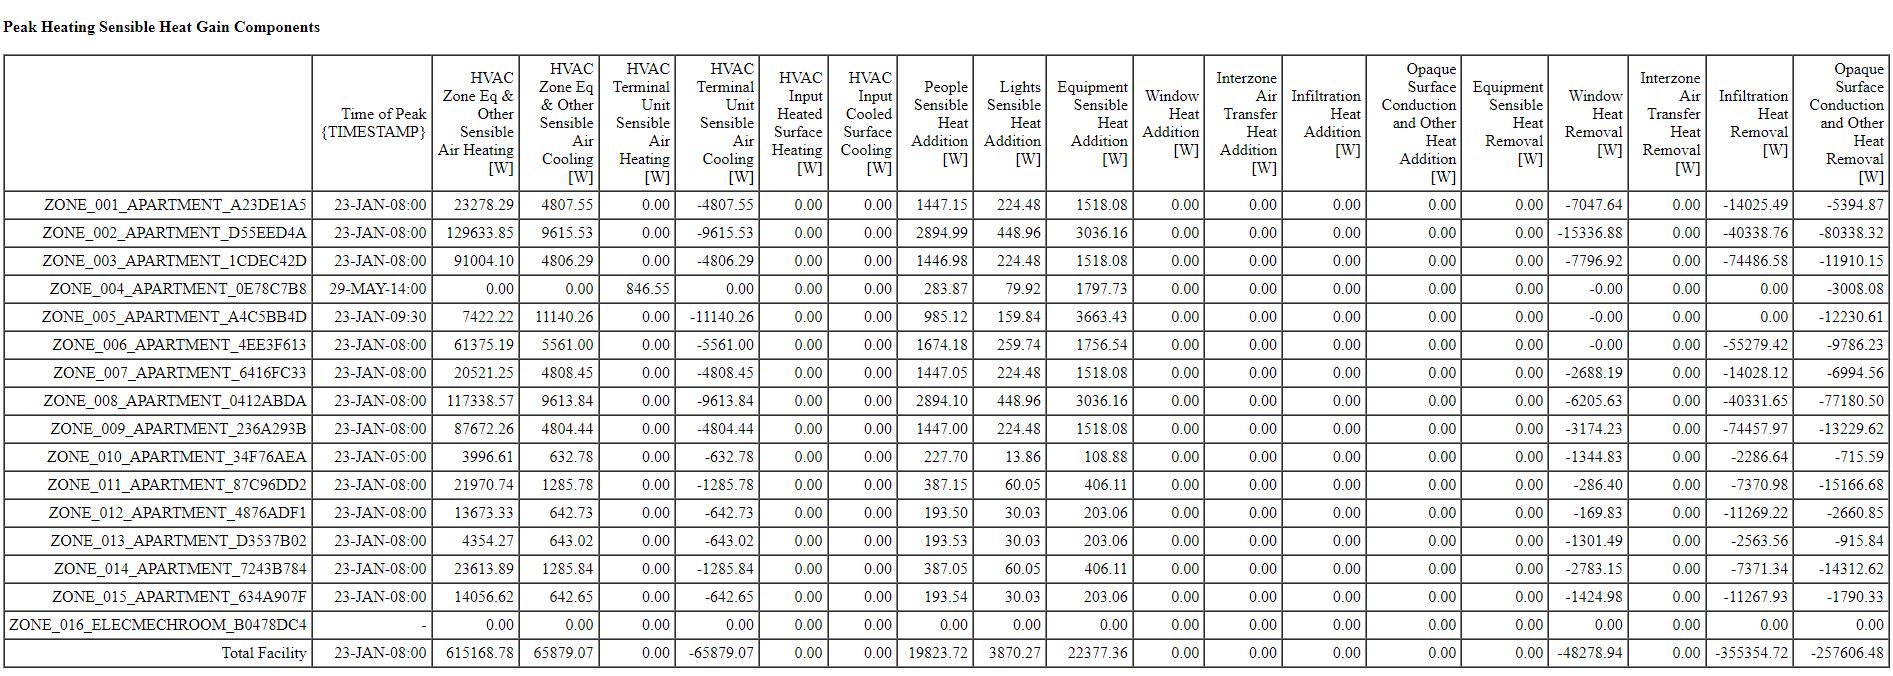
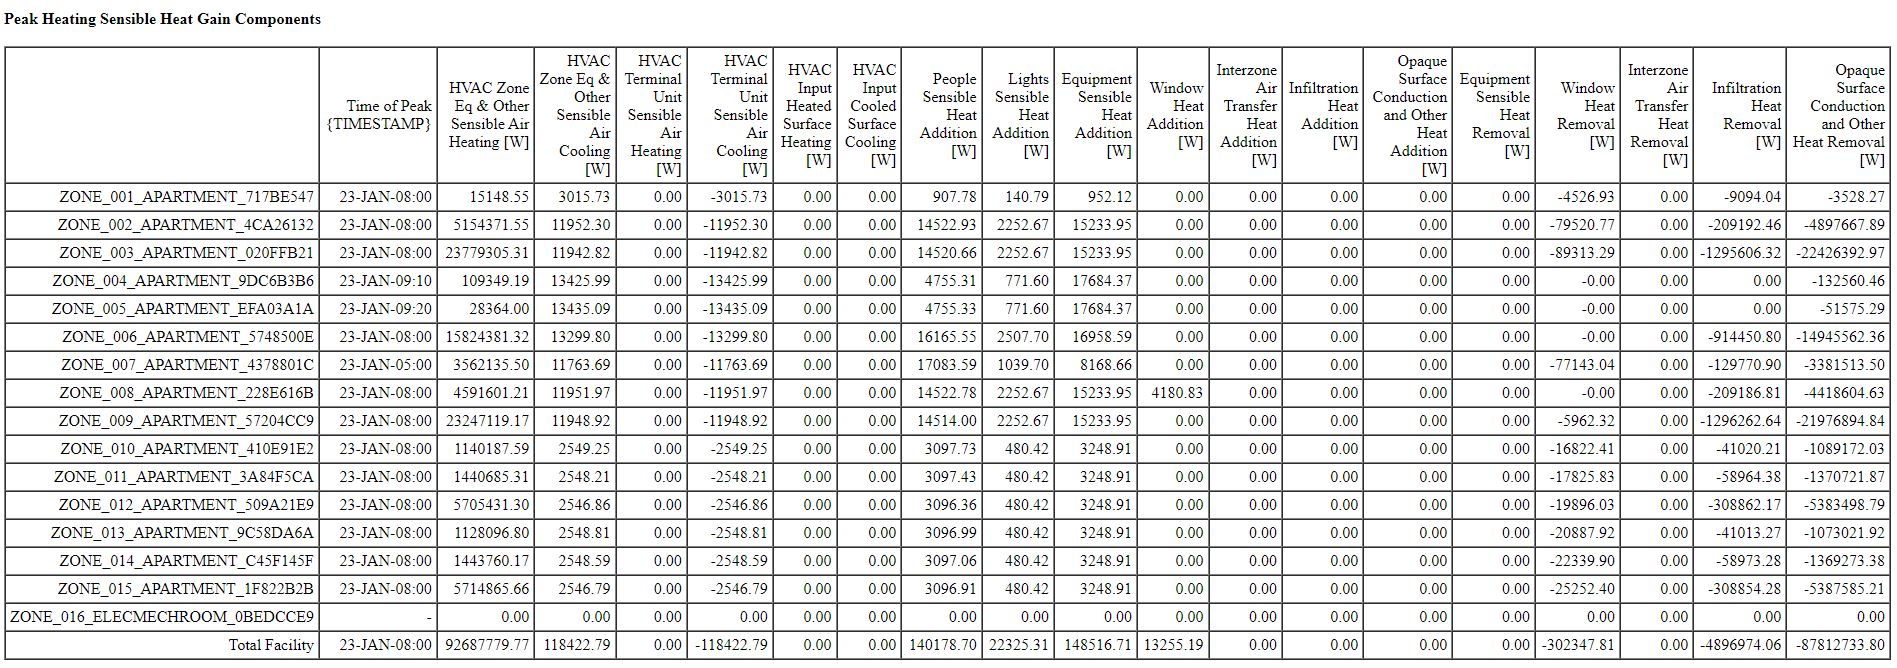
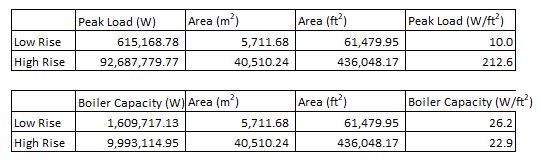
Looking at the Peak Heating Sensible Heat Gain Components, the peak heating for the entire facility of the high rise is much higher than the low rise (driven mostly by window heat loss and infiltration), which is expected. But normalizing for the floor area, the high rise's peak heating load is like 20x higher.

Low Rise

image description

High Rise

image description

When I look at the autosizing for the boiler, the normalized capacity between the two is pretty comparable, with the high rise actually doing better. There were no unmet heating hours in either building.

image description

I am a little perplexed... trying to demonstrate the impact of the ECMs on the peak heating and cooling loads but not sure the high rise peak sensible heat gain components seem reasonable in the high rise case as illustrated. Any insights or ideas would be greatly appreciated.

edit retag flag offensive close merge delete

2 Answers

Sort by ยป oldest newest most voted
1

answered 2022-07-22 09:54:06 -0500

Two suggestions.

  1. It's possible there's an issue with multipliers in the Sensible Heat Gain Component report. Try running it with multipliers of 1.0 and see if the numbers change as expected.
  2. Also, the ZoneComponentLoadSummary (and System and Facility) report is a more reliable peak load report.
edit flag offensive delete link more
0

answered 2022-07-18 15:57:41 -0500

saeranv's avatar

updated 2022-07-19 17:08:59 -0500

Are you sure there's only one boilers assigned to your the high-rise? The coincidental building peak capacity is 92 MW, but the boiler capacity is significantly less at 10 MW, so the highrise boiler isn't serving your entire building. If we assume a boiler per floor in the highrise, then the recalculated normalized capacity is (9.993M-W / (436000-ft2 / 18-lvls) = 412 W/ft2. This is 20X higher then lowrise, which aligns the relative size of the boiler and peak loads.

I'm not sure if it's reasonable for boiler capacity of a single highrise floor to be so much higher then your lowrise. This might be easier to confirm/debug without the zone multipliers.

edit flag offensive delete link more

Comments

Yes, there is only one boiler for the entire high rise. The boiler capacity is as listed, and is about 8x the size of the one in the low rise, which makes sense since the floor area is about 8x as much. The only thing that does not make sense is the peak heat load components which is 20x higher. Could that be some kind of weird outlier condition in the peak calculation and the boiler is autosized based on something more reasonable?

rktct999's avatar rktct999  ( 2022-07-19 17:33:54 -0500 )edit

Since the peak loads are used to size the boiler capacity, it seems unlikely to me that the boiler capacity could be correct while the peak loads are wrong.

The 20X increase in high-rise peak loads should be investigated though. Are the peak loads reported per zone meant to represent the peak for a single floor, or the single floor times its zone-multipliers? Are your annual loads also showing ~20X difference in high-rise and low-rise? The opaque surface conduction high-rise increase seems suspicious - could be could be a material/boundary mistake.

saeranv's avatar saeranv  ( 2022-07-19 21:27:45 -0500 )edit

Your Answer

Please start posting anonymously - your entry will be published after you log in or create a new account.

Add Answer

Training Workshops

Careers

Question Tools

2 followers

Stats

Asked: 2022-07-13 20:11:28 -0500

Seen: 501 times

Last updated: Jul 22 '22