Question-and-Answer Resource for the Building Energy Modeling Community
Get started with the Help page
Ask Your Question
0

Is there a tool to visualize eplusout.csv - e+ timeseries data?

asked 2 years ago

kpp's avatar

updated 2 years ago

The results in eplusout.csv are helpful in understanding if and how the changes in schedules or controls are affecting the plant performance and check the results at each time-step. I have been using following options to visualize the data from eplusout.csv

  1. Excel plots - This is good for quick checks but not an ideal as the number of data points and plots in the workbook go up
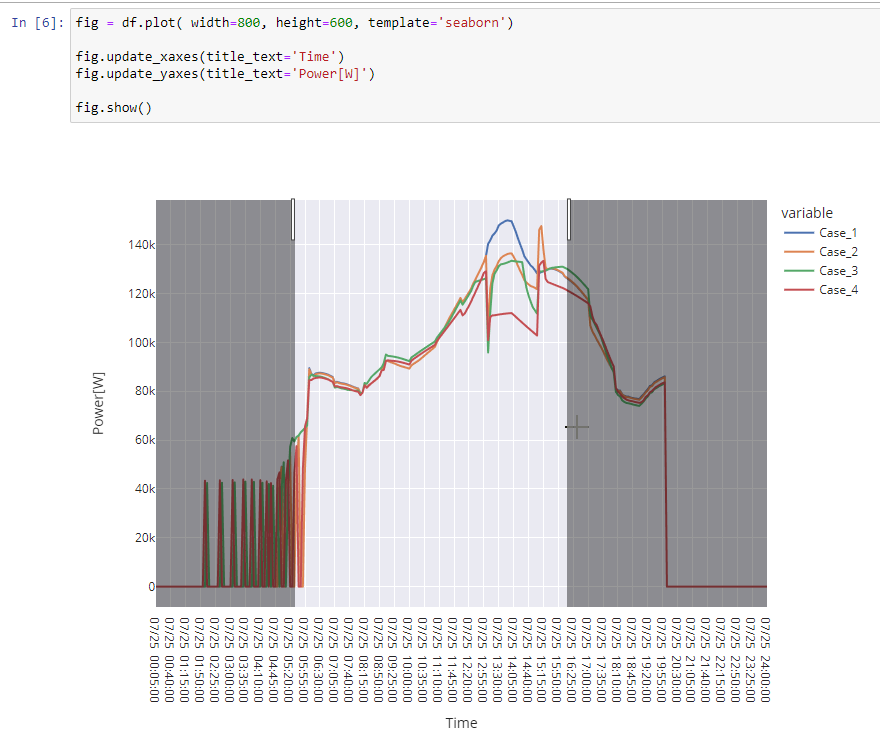
  2. Plotly/seaborn in Jupyter - This needs some scripting but good for pan, zoom in to the time-series data. image description

I was curious if there is any other better ways to achieve the same? E.g. drop multiple eplusout.csv for comparison in a tools and select variable to plot; pan, zoom in each plot etc.

Preview: (hide)

Comments

3

@kpp does this post answer your question? If you want to compare outputs from multiple runs, I would recommend DesignBuilder's Results Viewer and timestep.

Aaron Boranian's avatar Aaron Boranian  ( 2 years ago )

@Aaron Boranian it does! Just tested Timestep. It looks like easy to use tool. Thanks!

kpp's avatar kpp  ( 2 years ago )

1 Answer

Sort by » oldest newest most voted
2

answered 2 years ago

antoineg's avatar

updated 2 years ago

Check out Grafener, based on Grafana, intuitive and powerful time-series visualization tool. It fulfills all the use cases you mentioned (multi experiments comparison, pan/zoom, etc.). See also my original answer.

Disclaimer: I'm the author of this tool ;)

Preview: (hide)
link

Comments

The Grafener dashboard looks good! I will definitely test it out. Currently my organization laptop supports windows so may have to explore a bit on how to install/run the dependencies on Windows (or I will install VirtualBox and go that way).

kpp's avatar kpp  ( 2 years ago )

Your Answer

Please start posting anonymously - your entry will be published after you log in or create a new account.

Add Answer

Training Workshops

Careers

Question Tools

1 follower

Stats

Asked: 2 years ago

Seen: 272 times

Last updated: Jul 13 '22