Question-and-Answer Resource for the Building Energy Modeling Community
Get started with the Help page
Ask Your Question
2

Where to obtain breakdown of heat loss components in BEopt?

asked 2022-07-07 07:52:19 -0600

mka's avatar

updated 2022-07-07 12:54:15 -0600

I have built both single-family and multi-family homes on BEopt, and I am interested in knowing the heat loss across each of the homes. Where can I obtain an output that shows a breakdown of the heat loss components as well as the total heat loss?

Thanks in advance for any help.

edit retag flag offensive close merge delete

1 Answer

Sort by ยป oldest newest most voted
0

answered 2022-07-07 13:43:06 -0600

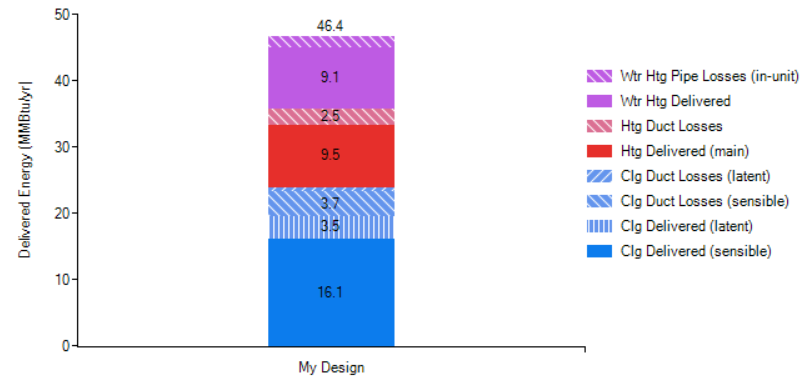
The current version of BEopt has the following breakout of heat loss in the lower-left output graph. It is called Delivered Energy, since it includes duct losses as well as the thermal effects of e.g. heat pump water heaters, heat recovery ventilators, and HVAC fan heat. You can read more about it in the BEopt help.

image description

There is unfortunately no way to get more detailed information about the contribution of walls vs windows vs other building components, though this level of detail is likely to be included in the next version of BEopt (version 3.0).

edit flag offensive delete link more

Comments

Thank you for the response. Can the more detailed information regarding heat losses through walls, windows, and other components be obtained from the EnergyPlus output files with the current version? If there is a way, would you please direct me?

mka's avatar mka  ( 2022-07-12 09:17:38 -0600 )edit
1

There is no direct output in EnergyPlus that contains this information, unfortunately. We do our own residential-specific calculations using (a lot of) E+ output variables.

Also, I was looking at adding this for BEopt v3 and realized there is one challenge: some of the components can have negative contributions to heating/cooling load. For example, internal gains will have a negative contribution to the heating load (i.e., they reduce the heating load), and the building slab can have a negative contribution to the cooling load. It's not easy to display negative values in a stacked bar chart..

shorowit's avatar shorowit  ( 2022-07-12 09:45:28 -0600 )edit

Your Answer

Please start posting anonymously - your entry will be published after you log in or create a new account.

Add Answer

Training Workshops

Careers

Question Tools

2 followers

Stats

Asked: 2022-07-07 07:52:19 -0600

Seen: 188 times

Last updated: Jul 07 '22