E+ is not handling precooling thermostat correctly in hourly simulation


Hi, all,
I am running an hourly simulation for a specific day in summer for a home in Phoenix. I have attached a precooling schedule for it. The schedule description is:
- 00:00 - 11:00 : 72F
- 11:00 - 15:00 : 65F (Precooling)
- 15:00 - 20:00 : 78F (Peak period)
- 20:00 - 24:00 : 72F
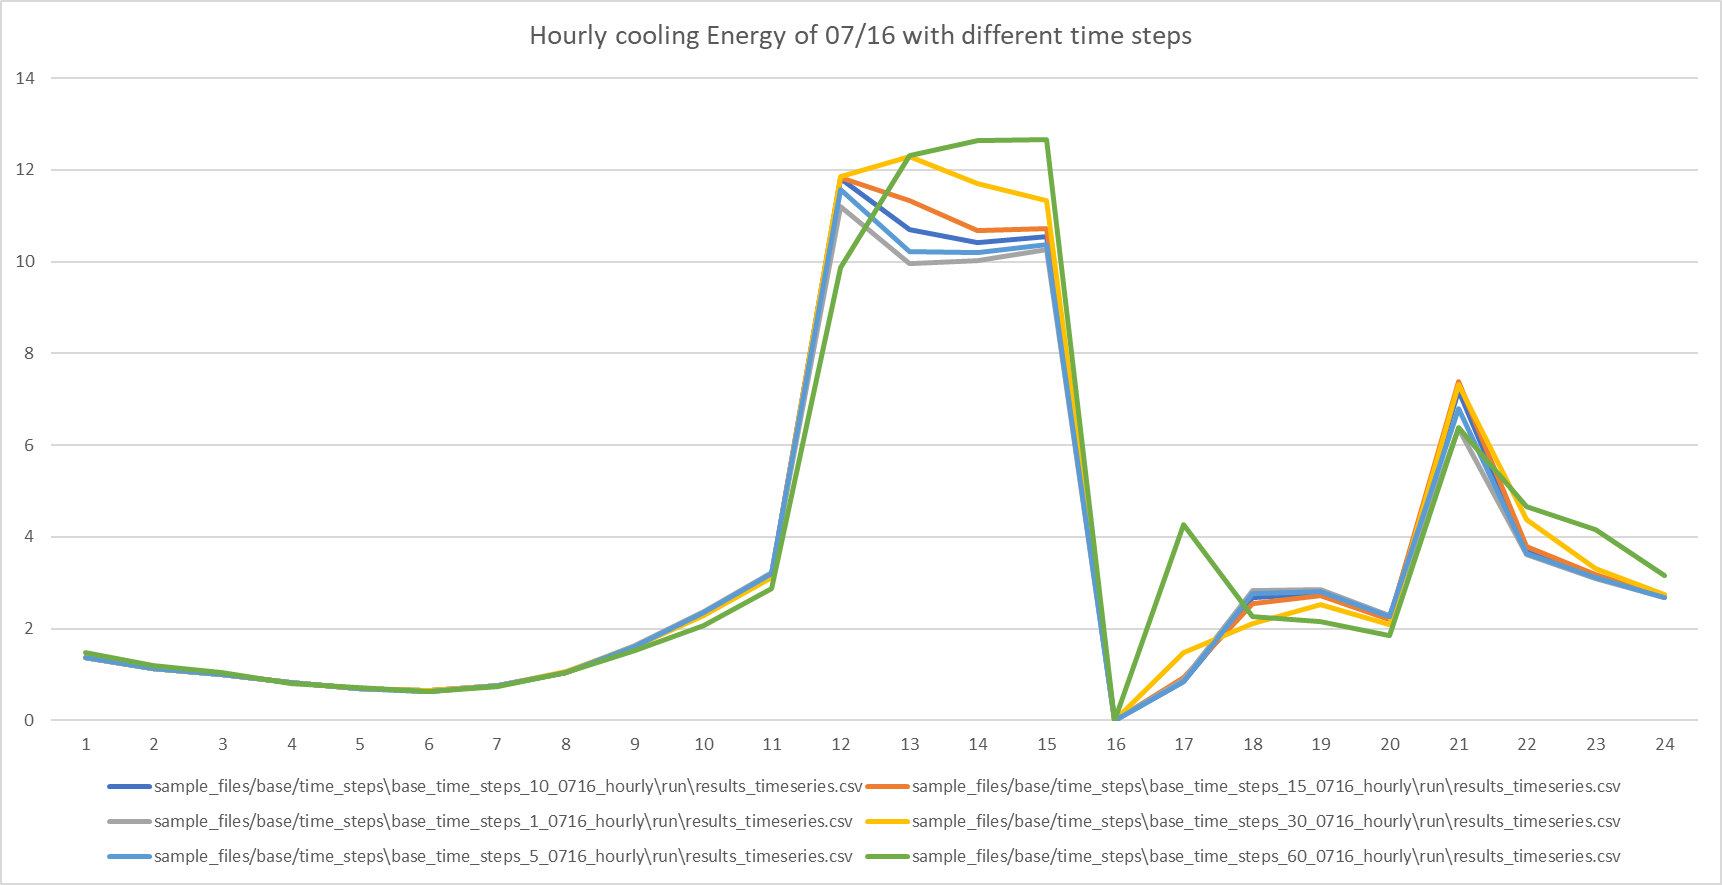
I have run different time steps and found hourly simulation results very suspicious, not only because of lack of accuracy, but also it showed a different trend. There's a cooling energy spike after 15:00 (end of precooling).
And I tracked down other E+ output variables for those hours and found:
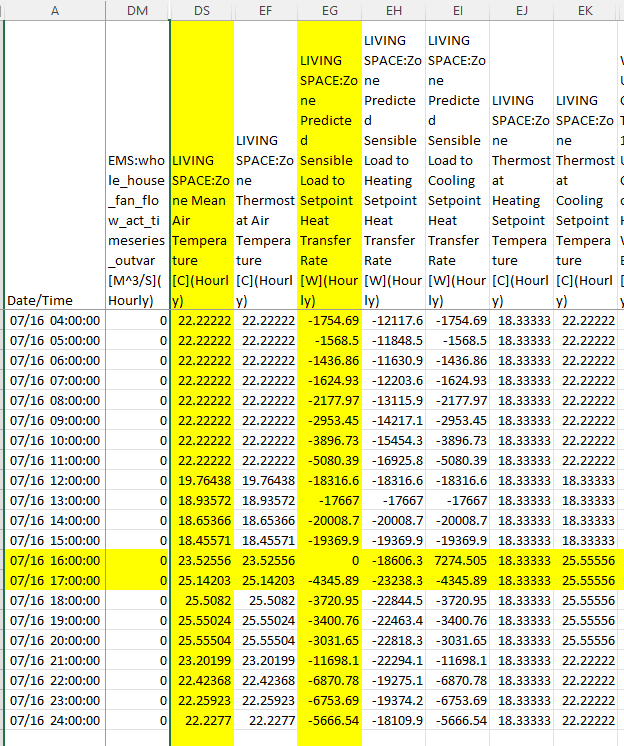
We can see that from 17: 00 to 20: 00 the zone air temperatures are below setpoints, but the predicted loads are negative implying cooling to be delivered. I can understand if there's only one last hour that the temperature decay is not able to cover the whole loads in that hour so extra cooling is needed, but there're consecutive hours. This makes me confused by what zone temperature/setpoint temperature E+ is using in calculating loads.
I did a few other things to investigate it more:
changed minimum system time step from 0 (60min) to 10min
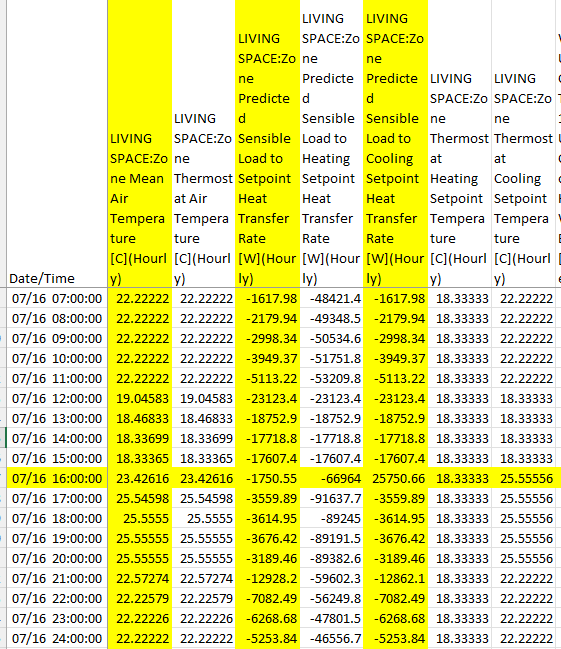
16:00 looks confusing. why there's a cooling energy if LIVING SPACE:Zone Predicted Sensible Load to Cooling Setpoint Heat Transfer Rate [W](TimeStep) is positive?
Compared with the 10 min simulation
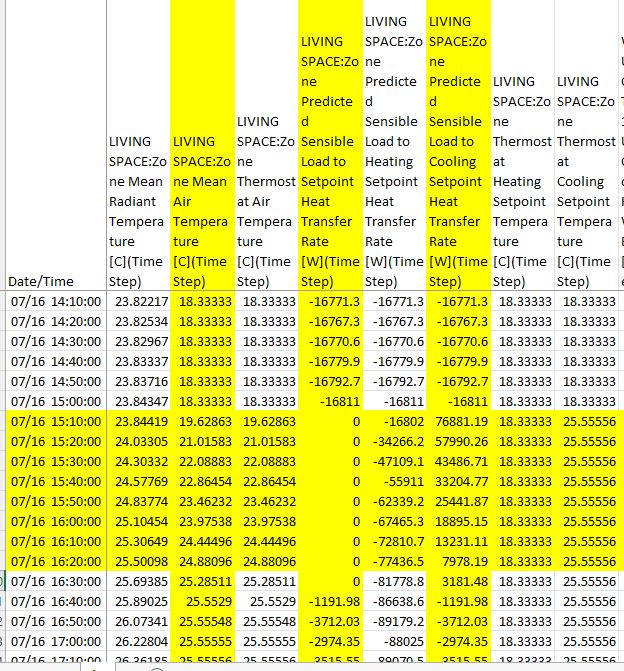
10min simulation results look reasonable to me.
Is there any one who is familiar with E+ load calculations that can give us some insights of this issue?

What is the zone timestep duration for all 3 tables (60min vs 10min)? The average hourly mean air temperature from 15:00 to 16:00 doesn't match in all 3 cases - from the looks of it, 10min for the last set of results (only)? Shorter zone timesteps obviously produce more reliable E+ predictions with drifting temperatures (easier to troubleshoot, especially with sharp adjustments in thermostat settings). Regardless, E+ predicts cooling @5pm in all 3 cases (values differ, but the trend is the same).
So why a greater predicted cooling load @5pm for the first (coarser, 60min?) set of results (vs 10min)? Maybe the E+ predictor is overshooting with such a long timestep? The previous (hourly?) timestep does have a +5K hike in mean air temperature, and E+ does rely on previous timestep values to make predictions. But that's not helping you ...
Zone time steps:
First table: 60mins
Second table: 60mins with minimum system timestep set to 10mins
Third table: 10mins
OK. And from the 1st table (column DM), no OA flow (in all cases)? And 25.14°C (77.25F) is within the deadband? For your 2nd question (2nd table), maybe plot
Zone Air Temperatureat detailed (not hourly) frequencies ... rather than (or in addition to)Zone Mean Air. Shouldn't one expect a gradual rise in updated zone air temperature at each system timestep, triggering (some) cooling (?) towards the end of the hour, e.g., remaining in the deadband until 15:45, then cooling from 15:45 to 16:00?Oh, and I came across this (similar experiments). Running @1min timesteps.