Varied values obtained when using the "Zone Predicted Sensible Load to Heating Setpoint Heat Transfer Rate"


Hi all,
I was just wondering would anyone have more information as to how the output:variable "Zone Predicted Sensible Load to Heating Setpoint Heat Transfer Rate" is calculated.
I have read the EnergyPlus literature which states.
"This is the predicted sensible load in W required to meet the current zone thermostat heating setpoint. A positive value indicates a heating load, a negative value indicates a cooling load. This is calculated and reported from the Predict step in the Zone Predictor-Corrector module. This value is not multiplied by zone or group multipliers."
The model I am using for my masters thesis was developed as part of a Phd and used a ground source heat pump (GSHP) with a thermal energy storage tank for space heating. I have installed an air to water source heat pump (AWSHP) system and disconnected the GSHP.
I am using the Zone Predicted Sensible Load to Heating Setpoint Heat Transfer Rate variable to try and create a space heating demand / outdoor ambient temperature curve against the heating capacity curve of the AWSHP.
How I have done this is by altering a weather file so that its dry bulb temperature varies almost in a sinusoid from 20 to -15 over the course of 26 days (1 Jan to 26 Jan). I have also taken the values of the 6 solar components (Wh/m2) and averaged them out over a heating season to get an accurate average representation of what they are.
I have assumed the only factors influencing this variable are the Delta T from the thermostatic setpoint and the solar gains (that I have averaged out).
Here is an example of one of the plots I have developed.
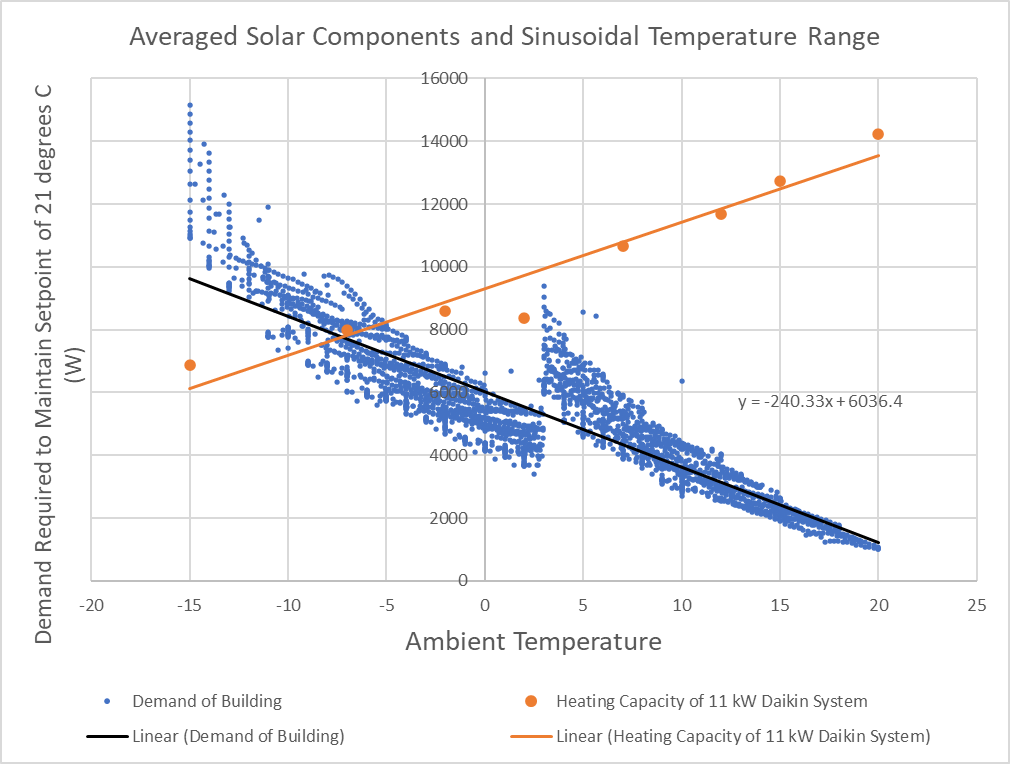
I am facing two problems, one is the kink in data that can be seen around the 3 degrees mark in the graph, the space heating demand is high until 3 degrees and then drops significantly after this.
Another problem I am facing is with regards the variability in this variable output, some times it provides sensical answers, other times it gives demand values that are incredibly large (150 kW when it should be around 15 kW).
Essentially I would like to know more about what external factors effect the output of this parameter and whether my approach to developing my desired plot is correct.
Thank you all and I can answer more questions if need be!
